Show Navigation
|
Hide Navigation
You are here:
Mapping and visualization > Symbolizing data > Applying symbology
Mapping and visualization > Symbolizing data > Applying symbology
Drawing all features with a single symbol |
|
|
Release 9.2
Last modified August 15, 2007 |


Print all topics in : "Applying symbology" |
Related Topics
About using a single symbol to draw features
Often, seeing where something is—and where it isn't—can tell you exactly what you need to know. Mapping the location of features reveals patterns and trends that can help you make better decisions. For example, a business owner might map where his customers live to help decide where to target his advertising.
The easiest way to see where features are is to draw them using a single symbol. You can draw any type of data this way. When you create a new layer, ArcMap draws it by default with a single symbol.
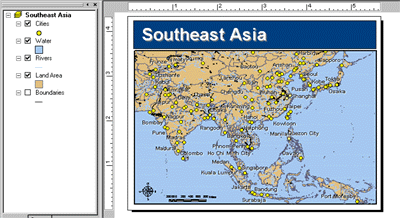
Example single symbol map
On a map that uses a single symbol to represent cities, you could easily see where people live and conclude that some areas are more densely populated based on the number of cities clustered together.
How to draw a layer using a single symbol
- Right-click the layer you want to draw with a single symbol in the table of contents and click Properties.
- Click the Symbology tab.
- Click Features in the Show box on the left side of the dialog box.
Because Single symbol is the only option under the Features renderer, ArcMap automatically selects it. - Click the Symbol button to change the symbol.
- Click a new symbol or change specific properties of the symbol in the Symbol Selector dialog box.
- Click OK on the Symbol Selector dialog box.
- Type a Label for the feature.
The label appears next to the symbol in the table of contents. - Click OK.
| Tips |
|