Extensions > Spatial Analyst > Analysis concepts > Density calculations
Density calculations |
|
|
Release 9.3
Last modified January 13, 2012 |


Print all topics in : "Density calculations" |
Note:
This topic was updated for 9.3.1.
You can calculate density using simple or kernel calculations. In a simple density calculation, points or lines that fall within the search area are summed, then divided by the search area size to get each cell's density value.
In kernel density, the values associated with each point are spread from the point location to the specified radius. The density is greatest at the point location and diminishes to zero at the specified radius. The sum of the intersecting spreads is calculated for each output cell. The result is a smoother distribution of values than with simple density.
Learn how to calculate density using the Spatial Analyst toolbar
Learn how to calculate point density using the Point Density tool
Learn how to calculate line density using the Line Density tool
Learn how to calculate kernel density using the Kernel Density tool
Point density calculations
Point density calculates the density of point features around each output raster cell. Conceptually, a neighborhood is defined around each raster cell center, and the number of points that fall within the neighborhood is totaled and divided by the area of the neighborhood.
If a Population field setting other than None is used, the Population Field's value (the item value) determines the number of times to count the point. Thus, an item value of three would cause the point to be counted as three points. The values can be integer or floating point. If an area unit is selected, the calculated density for the cell is multiplied by the appropriate factor before it is written to the output raster. For example, if the input ground units are meters, comparing a unit scale factor of meters to kilometers will result in multiplying the output values by 1,000,000 (1,000 x 1,000).
Uses include finding the density of houses, wildlife observations, or crime reports. The population field could be used to weigh some points more heavily than others, depending on their meaning, or to allow one point to represent several observations. For example, one address might represent a condominium with six units, or some crimes might be weighed more severely than others to determine overall crime levels.
Increasing the radius will not change the calculated density values much. Although more points will fall inside the larger neighborhood, this number will be divided by a larger area when calculating the density. The main effect of a larger radius is that density is calculated considering a larger number of points, which can be further from the raster cell. This results in a more generalized output raster.
Line density calculations
Line density calculates the density of linear features in the neighborhood of each output raster cell. Density is calculated in units of length per unit of area.
Density units are based on the linear unit of the projection of input features or as specified by the output coordinate system environment setting. Line density calculations convert the units of both length and area. For example, if the linear unit is meters, the area units will default to square kilometers and the resulting output will be kilometers per square kilometer. When the linear units are in feet, the area units will default to square miles and similarly, the density in units of the output will be miles per square mile. Alternatively you can specify a different area unit scale factor to convert the density units.
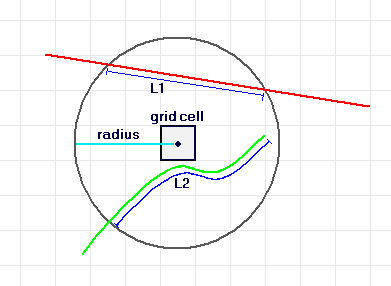
Conceptually, with line density, a circle is drawn around each raster cell center using a search radius. The length of the portion of each line that falls within the circle is multiplied by its Population field value. These figures are summed and the total is divided by the circle's area. The figure below illustrates this concept.

Length of lines contained by a circle around each cell.
The image is for a raster cell using a circular neighborhood. L1 and L2 represent the length of the portion of each line that falls within the circle. The corresponding Population field values are V1 and V2.
Density = ((L1 * V1) + (L2 * V2)) / (area of circle)
If a Population field other than None is used, the length of the line is considered to be its actual length times the value of the Population field for that line.
Uses include finding the density of roads as an influence on wildlife habitat or the density of utility lines in a town. The Population field could be used to weigh some roads or utility lines more heavily than others, depending on their size or class. For example, a divided highway probably has more impact than a narrow dirt road to wildlife habitat, and a high-tension line has more impact than a standard electric pole to visual quality.
Kernel density calculations
Kernel density calculates the density of features in a search radius around those features. It can be calculated for both point and linear features.
Kernel density for point features
Conceptually, a smooth, curved surface is fitted over each point in kernel density for point features. The surface value is highest at the location of the point and diminishes with increasing distance from the point, reaching zero at the search radius distance from the point. The volume under the surface equals the Population field value for the point or one if None is specified. The density at each output raster cell is calculated by adding the values of all the kernel surfaces where they overlay the raster cell center. The kernel function is based on the quadratic kernel function described in Silverman (1986, p. 76, equation 4.5).
If a Population field setting other than None is used, the Population field's value (the item value) determines the number of times to count the point. Thus, an item value of three would cause the point to be counted as three points. The values can be integer or floating point. If an area unit is selected, the calculated density for the cell is multiplied by the appropriate factor before it is written to the output raster. For example, if the input ground units are meters, comparing a unit scale factor of meters to kilometers will result in the values being different by a multiplier of 1,000,000 (1,000 x 1,000).
Uses are similar to those of point density, which include finding density of houses, wildlife observations, or crime reports. The Population field could be used to weigh some points more heavily than others, depending on their meaning, or to allow one point to represent several observations. For example, one address might represent a condominium with six units, or some crimes might be weighed more severely than others in determining overall crime levels.
Kernel density for line features
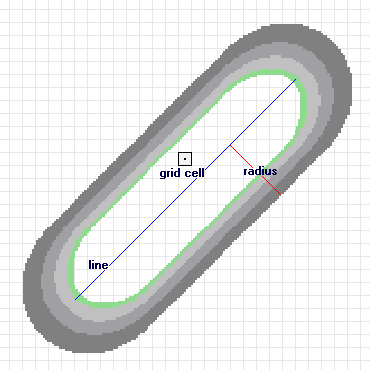
Conceptually, a smooth, curved surface is fitted over each line in kernel density for line features. Its value is greatest when it is on the line and diminishes as it moves away from the line, reaching zero at the search radius distance from the line. The surface is defined so that the volume under the surface equals the product of line length and the Population field value. The density at each output raster cell is calculated by adding the values of all the kernel surfaces where they overlay the raster cell center. The use of the kernel function for lines is adapted from the quadratic kernel function for point densities as described in Silverman (1986, p. 76, equation 4.5).

Line segment with surface kernel fitted.
In the image above, a line segment is displayed with a kernel surface fitted over it. The contribution of this segment to density equals the value of the kernel surface at the raster cell center.
By default a unit is selected based on the linear unit of the projection definition of the input polyline feature data or as otherwise specified in the output coordinate system. Similar to line density calculations, it converts the units of both length and area. If the linear unit of the feature class is meters, the area units will default to square_kilometers, and the resulting line density will be kilometers per square kilometer. When the linear unit of the feature class is feet, the area units will default to square_miles. Alternatively you can specify a different density area unit for the result.
If a Population field other than None is used, the length of the line is considered to be its actual length times the value of the Population field for that line.
Uses are similar to those of line density, which include finding the density of roads as an influence on wildlife habitat, or the density of utility lines in a town. The Population field could be used to weigh some roads or utility lines more heavily than others, depending on their size or class.
Main difference between point, line, and kernel density
The difference between point density and line density is that the first is applied to point features and the second to linear features. The two calculate the quantity specified by the Population field that falls within the identified neighborhood and divide that quantity by the area of the neighborhood.
The difference between point or line density and kernel density is that in point and line density, a neighborhood is specified that calculates the density of the population around each output cell. Kernel density spreads the known quantity of the population for each point out from the point location. The resulting surfaces surrounding each point in kernel density are based on a quadratic formula with the highest value at the center of the surface (the point location) and tapering to zero at the search radius distance. For each output cell, the total number of the accumulated intersections of the individual spread surfaces is calculated.
Density analysis references
Silverman, B.W. Density Estimation for Statistics and Data Analysis. New York: Chapman and Hall, 1986.