Extensions > Spatial Analyst > Spatial Analyst functional reference > Neighborhood (Spatial Analyst)
FocalSum |
|
|
Release 9.3
Last modified September 7, 2011 |


Print all topics in : "Neighborhood (Spatial Analyst)" |
Adds the values within a specified neighborhood for each cell location on an input raster and sends the sum to the corresponding cell location on the output raster.
Illustration
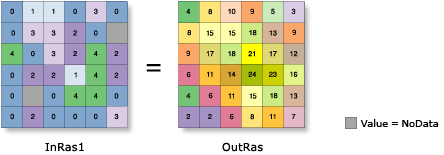
Map Algebra:
OutRas = FocalSum (InRas1, rectangle, 3, 3)
Usage tips
-
If the values in the input raster are integer, the values on the output raster will be integer; if the values on the input raster are floating point, the values on the output raster will be floating point. There is one exception to these rules: When the kernel file for the weight neighborhood contains floating-point values and is applied to an integer raster, the resultant output raster will contain floating-point values.
-
To demonstrate how the output values are calculated, consider the following subscene from the Illustration example:

The sorted values in this neighborhood are 0, 1, 2, 2, 2, 3, 3, 4, 4. The sum of these values is 21, which will be the output cell value. -
Learn more about how to specify the input raster dataset in the Map Algebra expression of Raster Calculator.
Map Algebra
Command line syntax
See Focal Statistics
Scripting syntax
See Focal Statistics
Map Algebra syntax
FocalSum(<grid>, {DATA | NODATA})
FocalSum(<grid>, <CIRCLE>, <radius>, {DATA | NODATA})
FocalSum(<grid>, <ANNULUS>, <inner_radius>, <outer_radius>, {DATA | NODATA})
FocalSum(<grid>, <WEDGE>, <radius>, <start_angle>, <end_angle>, {DATA | NODATA})
FocalSum(<grid>, <IRREGULAR>, <kernel_file>, {DATA | NODATA})
FocalSum(<grid>, <WEIGHT>, <kernel_file>, {DATA | NODATA})
Each usage listed above specifies a different type or shape of neighborhood in which to determine the sum of the values. The possible neighborhood shapes are rectangle, circle, annulus, wedge, irregular, and weighted irregular. Following each keyword are the necessary parameters, which further define the shape itself. If no neighborhood is specified, as is the case in the first usage, the default neighborhood is a 3 x 3 rectangle.
| Parameter | Explanation |
| <grid> | An input integer, floating-point raster, or an expression resulting in a raster that identifies the values of the cells in a specified neighborhood
If no neighborhood is specified, the default neighborhood is a 3 x 3 rectangle. |
| {DATA | NODATA} | A keyword defining the manner in which NoData values within a neighborhood will influence the output results.
|
| <RECTANGLE> | Defines the shape of the neighborhood as a rectangle.
The x,y position for the processing cell within the neighborhood, with respect to the upper-left corner of the neighborhood, is determined by the following equations: x = (width of the neighborhood + 1)/2 y = (height of the neighborhood + 1)/2 If the input number of cells is even, the x- and y-coordinates are computed using truncation. For example, in a 5 x 5 cell neighborhood, the x- and y-values are 3,3. In a 4 x 4 neighborhood, the x- and y-values are 2,2. 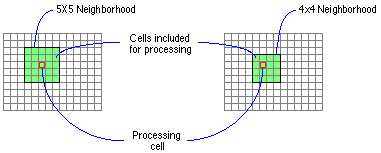
|
| <width> | Identifies the number of cells in the raster's x-direction that the neighborhood will encompass. |
| <height> | Identifies the number of cells in the raster's y-direction that the neighborhood will encompass. |
| <CIRCLE> | Defines the shape of the neighborhood as a circle
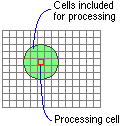
|
| <radius> | Specifies the radius that the circular or wedge-shaped neighborhood will span.
The radius is defined in cells and is measured perpendicular to the x- or y-axis. Any cell center encompassed by the circle or wedge will be included in processing the neighborhood. |
| <ANNULUS> | Defines the shape of a neighborhood as an annulus.
The annulus shape comprises a smaller circle within a larger circle (a donut shape). The corresponding block on the output raster will be the minimum-bounding square that encompasses the annular neighborhood. The inner and outer radii are measured on either the x- or y-axis from the center of the corresponding output block. Cells that fall outside the radius of the smaller circle but inside the radius of the larger circle will be included in processing the neighborhood. 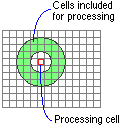
|
| <inner_radius> | Specifies the radius of the inner circle of the annulus from the center of the processing cell.
The radius is identified in cells measured perpendicular to the x- or y-axis. Any cell center that falls within this radius will not be included in the processing of the neighborhood. |
| <outer_radius> | Specifies the radius of the outer circle of the annulus from the center of the processing cell.
The radius is identified in cells measured perpendicular to the x- or y-axis. Any cell center that falls outside this radius will not be included in the processing of the neighborhood. |
| <WEDGE> | Defines the shape of a neighborhood as a wedge, or a piece of a circle.
The wedge shape is created by (1) specifying the radius from the center of the processing cell in cells measured perpendicular to the x- or y-axis and (2) identifying the angle of the wedge. See also the <radius> argument above and the <start_angle> and <end_angle> arguments below. Cells that fall within the wedge will be included in the processing of the neighborhood. 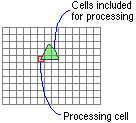
|
| <start_angle> | An integer or floating-point value from 0 to 360 (a circle) that defines the starting vector of a wedge.
The values of the circle begin with 0 on the positive x-axis (3:00 on a clock) and increase counterclockwise until they return to 0. |
| <end_angle> | An integer or floating-point value from 0 to 360 that defines the ending vector of a wedge.
The angle of the wedge is established by the difference between the starting and ending vectors. |
| <IRREGULAR> | Allows specifying an irregularly-shaped neighborhood around the processing cell.
The keyword IRREGULAR also defines the manner in which the values of the kernel file will be interpreted. The kernel file specifies which cell positions should be included within the neighborhood. The values in the kernel file should be either zero or one (any value not equal to zero will be interpreted as one). A value of zero for a cell position indicates that the cell is not a member of the neighborhood; a value of one for a cell position indicates that its corresponding cell (and value) is a member of the neighborhood. The x,y position for the processing cell within the neighborhood, with respect to the upper left corner of the neighborhood, is determined by the following equations: x = (width + 1)/2 y = (height + 1)/2 If the input number of cells is even, the x and y coordinates are computed using truncation. |
| <kernel_file> | Defines the values and shape of an irregular neighborhood.
When the kernel file is used with the IRREGULAR keyword, any value not equal to zero identifies the cells in a neighborhood that will be used for processing. The kernel file is an ASCII text file in which the first line specifies the width and height of the neighborhood (the number of cells in the x-direction, followed by a space, and the number of cells in the y-direction). The subsequent lines give the values of each position in the neighborhood. The values are input in the same configuration as appears in the neighborhood they represent. A space between each value is necessary. For a kernel file to be used with the IRREGULAR keyword, a neighborhood must be represented by ones and zeros. The value zero (not a blank space) identifies the cells in a neighborhood that will not be used for processing. 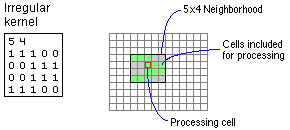
When a kernel file is used with the keyword WEIGHT, the number of cells along the x- and y-axes (the width and height of the neighborhood) are listed on the first line. All weight values, which further define the neighborhood, are listed on subsequent lines. When processing the neighborhood of a cell on the input raster, the value at each cell position in the neighborhood is multiplied by the value of the corresponding cell position in the kernel file, and the products are added within the neighborhood. A zero within the kernel file is treated like any other value in the file: the value of the cell on the input raster is multiplied by zero and the product is used in determining the mean of the neighborhood. 6 6 3 0 0 0 0 0 0 3 0 0 0 0 0 0 3 0 0 0 0 0 0 3 0 0 0 0 0 0 3 0 0 0 0 0 0 3 |
| <WEIGHT> | Allows defining an irregular neighborhood and specifying which weights will be used to multiply the cell values on an input raster.
See the <kernel_file> argument above for the specifications of the kernel file as it applies to the keyword WEIGHT. The x,y position for the processing cell within the neighborhood, with respect to the upper left corner of the neighborhood, is determined by the following equations: x = (width + 1)/2 y = (height + 1)/2 If the input number of cells is even, the x and y coordinates are computed using truncation. |
Map Algebra example
focalsum(ingrid1)
focalsum(ingrid1, NODATA)
focalsum(ingrid1, rectangle, 5, 5)
focalsum(ingrid1, circle, 3, NODATA)
focalsum(ingrid1, annulus, 2, 7)
focalsum(ingrid1, wedge, 7, 45, 90)
focalsum(ingrid1, irregular, irregular.txt)
focalsum((ingrid1 + ingrid2), rectangle, 3, 3)
focalsum(sin(ingrid1), NODATA)
ArcObjects syntax
See Focal Statistics