NOTE: If you are authoring a task to be consumed by more than one of the supported clients (ArcMap, ArcGIS Explorer, or a Web mapping application), use simple symbology. By using simple symbology, you avoid having multiple services, one for each of the different clients.
When a task's output data is drawn by an result map service, the layer symbology found in the task's corresponding tool layer is used. You can use any layer symbology since ArcMap (running on the server) will be drawing the data and transporting an image of the completed map back to the client. The capabilities of the client do not affect how ArcMap draws the result.
When the output is drawn by the client, you can only use certain layer symbologies. This is true even for ArcMap clients running on the client's machine.
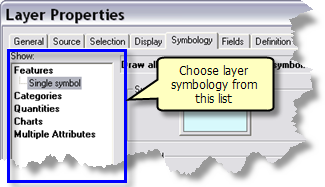
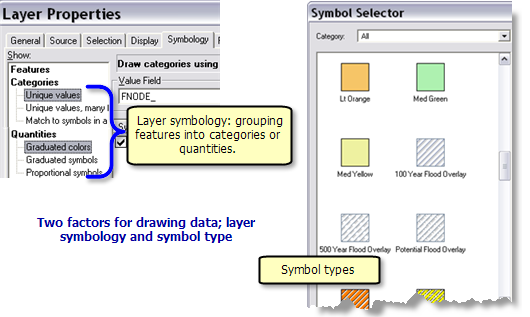
To choose a layer symbology, right-click a layer in ArcMap and click Properties. In the Layer Properties dialog box, click Symbology. The list of layer symbologies is on the left, as illustrated below.
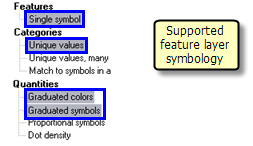
Feature layer symbology supported by all clients
For feature layers, the following layer symbologies are supported by all clients:
- Features
- Categories
- Quantities
- Graduated colors
- Graduated symbols
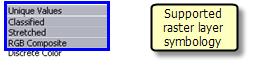
Raster layer symbology supported by all clients
For raster layers, the following layer symbologies are supported by all clients:
- Unique Values
- Classified
- Stretched
- RGB Composite (available only for multiband images)
Transparency, brightness, and contrast
In addition to the layer symbology you define in the Symbology tab, you can also set transparency, brightness, and contrast for the layer in the Display tab of the Layer Properties dialog box. Transparency is available for both feature and raster layers. Brightness and contrast are only available for raster layers.
Two methods for specifying layer symbology
You can define the layer symbology to use by
- Specifying layer symbology in your model or script
- Modifying the corresponding tool layer symbology
Specifying layer symbology in your model or script
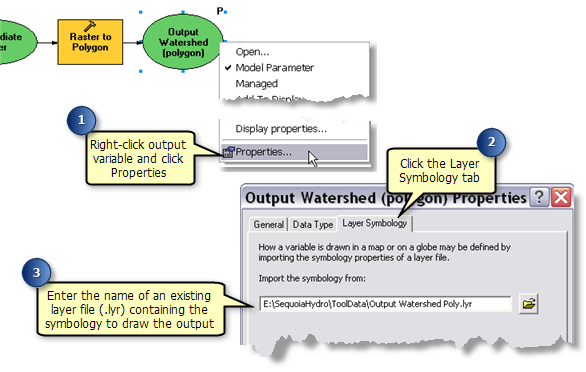
You can specify layer symbology in your model or script by setting the
Layer Symbology property on your output variable, as illustrated below. The example shows a model, but the same capability is available for scripts.
You can also use the
Apply Symbology From Layer tool in your model or script.
Whether you use a layer symbology file or the Apply Symbology From Layer tool is up to you. They are functionally equivalent.
If you are publishing a geoprocessing toolbox (as opposed to a source map document containing tool layers), these are the only two methods available to you to specify symbology.
NOTE: Complete details on using a layer symbology file or the Apply Symbology From Layer tool can be found in the topic Setting symbology for output data.
Modifying tool layer symbology
When publishing a geoprocessing service, you can publish an ArcMap document containing tool layers. Each tool layer becomes a task in the service. The outputs of your model or script are displayed as sublayers of the tool layer. If the output of your model is a dataset and you are using a tool layer, the symbology of the sublayer is used to produce the layer drawing description.
You can change the symbology properties of these sublayers (right-click the sublayer and click Properties) and the output of your model or script will be displayed with the symbology you set for the sublayer.
- If the output of your model or script is a layer (such as a feature layer or raster layer), the symbology specified in the output layer will always be used. The reason for this rule is that some tools output layers containing custom symbology. In order to preserve this custom symbology, the symbology in the tool sublayer must be ignored.
- If the output of your model is a dataset (such as a feature class or raster), the symbology defined by the tool sublayer will be used.
Dynamic update of symbology
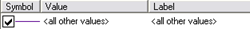
When you are symbolizing data in unique value categories, the state of the <all other values> check box, illustrated in the table below, determines how the data will be symbolized.
|
Checked—the data will be symbolized as specified. The legend is unchanged. No new categories are created. This is referred to as static symbology. |
|
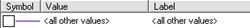
Unchecked—the data will be read and new categories will be created based on the data. The legend will change. This is referred to as dynamic symbology. |
If you are symbolizing data with graduated colors or symbols, you will specify the number of classes to create. Output data will automatically be reclassified into the number of classes you specify. To prevent reclassification, use a manual classification, as described in the topic
Setting symbology for output data.
NOTE: This dynamic update of symbology only occurs if the client is drawing the data. If the result map service draws the data, the symbology is static (that is, the legend does not update to reflect new data values).
If your output is to be drawn by a result map service, the client is not responsible for symbolizing data—the result map service (which uses ArcMap running on the server) will create a map image and send the map image to the client. Therefore, you can use any symbol type supported by ArcMap.
The remainder of this discussion deals with geoprocessing services that do not use a result map service. In these services, the client is responsible for drawing the data. Whenever the client draws the data, you need to be aware of what symbol types are supported by the client.
How symbol types are defined in ArcMap
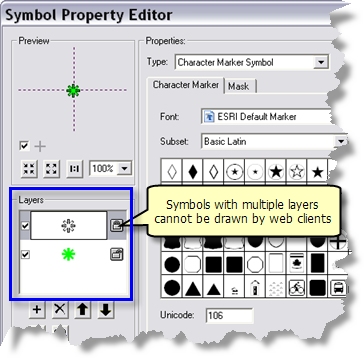
You can inspect and define the symbol type in the Symbol Property Editor dialog box, as illustrated below. There are two ways to open the Symbol Property Editor:
- Click the symbol in the ArcMap layer. This opens the Symbol Selector dialog box. Click Properties. This opens the Symbol Property Editor, as illustrated below.
- Right-click the layer and click Properties. This opens the Layer Properties dialog box. Click the Symbology tab. For any symbol displayed in the dialog box, you can double-click the symbol to open the Symbol Property Editor.
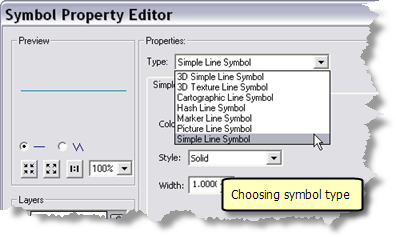
The type of symbol is displayed in the Type drop-down menu, as illustrated above. You can choose different types.
Four types of clients
For the purpose of this discussion, there are four types of clients:
- ArcMap
- ArcGIS Explorer
- Web applications such as those built with the ArcGIS Server Manager
- Web applications that display KML such as Google Earth™
Symbol types supported by ArcMap clients
If your service is only to be used by ArcMap clients, you can use any symbol type found in ArcMap.
Symbol types supported by ArcGIS Explorer
ArcGIS Explorer is a lightweight client and only knows how to draw simple symbols. The table below shows the ArcMap symbol types that ArcGIS Explorer clients can use.
| Points |
Lines |
Polygons |
|---|
| Simple Marker Symbol |
Simple Line Symbol |
Simple Fill Symbol |
| Character Marker Symbol |
|
Picture Fill Symbol |
| Picture Marker Symbol |
|
|
| 3D symbols found in the ArcGIS_Explorer symbol style (see note below) |
|
|
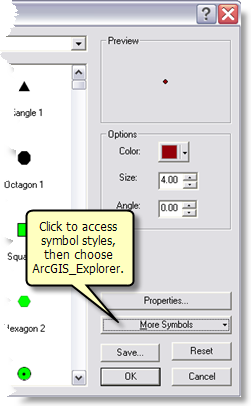
ArcGIS Explorer is a 3D application and can draw 3D symbols. There is a symbol style named ArcGIS_Explorer that contains the 3D symbols that ArcGIS Explorer can draw. To access the symbols in this style, click More Symbols in the Symbol Selector dialog box, as illustrated below, then choose the ArcGIS_Explorer symbol style. The 3D symbols supported by ArcGIS Explorer will be added to the list of available symbols. You can use 3D symbols not found in the ArcGIS_Explorer style, but you need to thoroughly test your service with ArcGIS Explorer. Some 3D symbols may not draw correctly, especially for complex 3D symbols such as buildings.
Web applications
The table below shows the ArcMap symbol types that Web clients can use.
| Points |
Lines |
Polygons |
|---|
| Simple Marker Symbol |
Simple Line Symbol |
Simple Fill Symbol |
| Character Marker Symbol (see note below) |
|
Picture Fill Symbol |
| Picture Marker Symbol |
|
|
Character Marker Symbols can have multiple symbol layers, as illustrated below. Symbols with multiple layers cannot be drawn by Web clients.
Web applications using KML
Web applications using KML support the same symbol styles shown for Web applications above. For a complete discussion of KML and compatible symbol styles, follow the links below.
Learn more about KMLLearn more about symbol styles compatible with KML


 You have two choices for drawing the data output by a geoprocessing task: