Data
The data for this example comes from C:\arcgis\ArcTutor\GP Service Examples\Watershed. This data, in turn, was derived from C:\arcgis\ArcTutor\Spatial. To learn how the data in the Watershed folder was created, see the
Watershed example.
Basemap
The basemap for this example, StoweHillshade.mxd, has only one layer, Hillshade, as illustrated below. The Hillshade layer is drawn with a transparency of 55 percent.
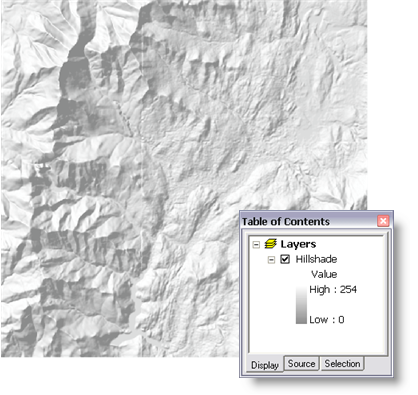
StoweHillshade is published as a map service.
Toolbox and map document
The toolbox for the geoprocessing service is StoweStreamNet, and the source map document for the service is StoweStreamNet.mxd. StoweStreamNet.mxd contains two source data layers, Flow Direction (the flowdir raster) and Flow Accumulation (the accumulation raster).
Model overview
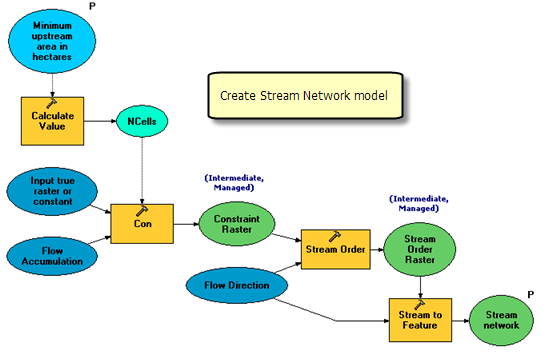
The Create Stream Network model is illustrated below. There is one input variable, Minimum upstream area in hectares. This variable is a double and is the minimum drainage area required to create a stream segment. Smaller areas create more stream segments.
The model calculates the number of raster cells for the input area and then uses the
Con tool to perform a conditional if/else evaluation on each of the input cells in the Flow Accumulation raster. Since a cell value in the Flow Accumulation raster is the number of upstream cells flowing into the cell, any cell with an upstream area greater than the cutoff is selected. Selected cells form stream segments and are assigned a one (1) in the output raster.
The
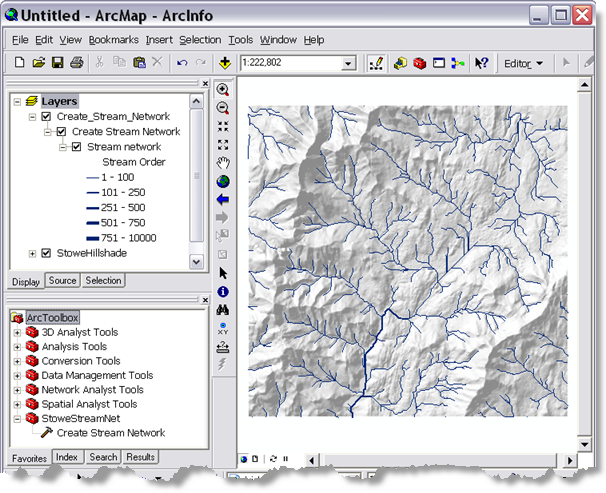
Stream Order tool assigns a numeric order value to a raster representing branches of a linear network such as the output of the Con tool. In general, streams with a high order have higher water flows, so stream order can be used as a surrogate for stream width. The output of the model is symbolized so that segments with high–order values are drawn with thicker lines.
The
Stream to Feature tool converts the stream order raster into the output line feature class. This feature class will be drawn by the result map service using symbology defined in the result map service.
Details about the model follow.
Project data
The Flow Accumulation and Flow Direction variables are layers from the source map document, StoweStreamNet.mxd. These variables are termed project data because they are nonparameter input data.
Calculating number of cells for the minimum area
The Flow Accumulation and Flow Direction rasters are Vermont State Plane coordinates, which are meters. The cell size is 30 by 30 meters. To determine the spatial reference and cell size of a raster
- In ArcCatalog, right-click the raster and click Properties.
- In ArcMap, right-click a raster layer, click Properties, then click the Source tab.
The
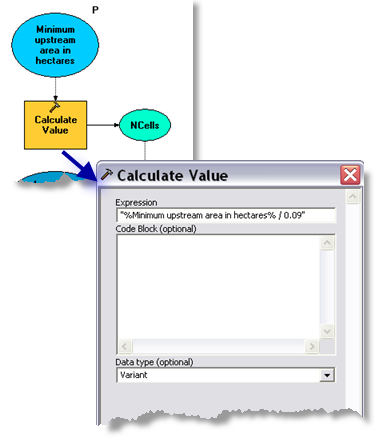
Calculate Value tool divides the input hectares by the size of a cell in hectares (30 x 30 meters = 900 square meters = 0.09 hectares) to yield the number of cells for the minimum upstream area. The parameters for Calculate Value, illustrated below, make use of variable substitution. By placing percent signs (%) around a variable name, the contents of the variable are substituted for the value.
The Minimum upstream area variable in hectares is a double data type, created as follows:
- Right-click on the ModelBuilder canvas, click Create Variable.
- In the Create Variable dialog box, choose Double as the data type.
- Click OK.
- Rename the newly created variable.
- Double-click the variable and enter a default value. For the Stowe area, 45 is a reasonable default.
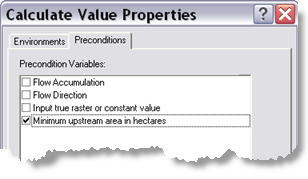
The Minimum upstream area in hectares variable is a precondition to the execution of Calculate Value. A precondition means that a variable must contain a value before Calculate Value executes. You can set preconditions as follows:
- Right-click Calculate Value.
- Click Properties.
- Click the Preconditions tab.
- Check Minimum upstream area in hectares, as illustrated below.
Con process
The
Con tool, illustrated below, performs a conditional if/else evaluation on each of the input cells in the Flow Accumulation raster.
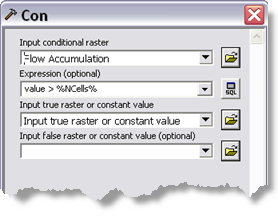
Note that the expression makes use of variable substitution, as shown with the Calculate Value tool above. In the expression, all cells with a value greater than the minimum number of cells are selected. (The value of a cell in the Flow Accumulation raster is the number of cells flowing into an individual cell.)
The Input true raster or constant value parameter is the value to assign each selected cell and is set to 1. If you are creating this model from scratch, do the following:
- Double-click the Con tool (alternatively, right-click the tool and click Open).
- For the Input true raster or constant value parameter, enter 1.
- Click OK.
- The Input true raster or constant value model variable is automatically created and connected to the Con tool.
Stream order process
The
Stream Order tool calculates a numeric value for cells that represent branches of a stream network. The parameter values for Stream Order are illustrated below.
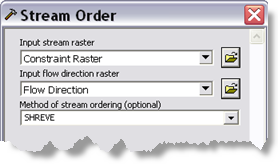
The output raster contains the Shreve stream order value for every cell that represents a stream.
Stream to Feature process
The
Stream to Feature tool creates a shapefile of the stream segments contained in the Stream Order raster.
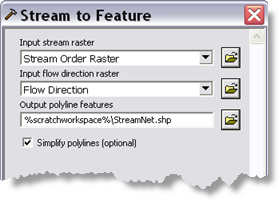
Note that the output is written to %scratchworkspace%. This location is the
scratch workspace environment that is set and used by ArcGIS Server.
The tool layer in StoweStreamNet.mxd defines the result map symbology. The steps show how to create the tool layer and appropriate symbology from scratch.
- In ArcMap, add the StoweStreamNet toolbox to the ArcToolbox window.
- Drag and drop the Create Stream Network tool from the ArcToolbox window into the ArcMap table of contents to create the Create Stream Network tool layer.
- Right-click the Create Stream Network tool layer and click Open.
- Use 45 (the default) as the minimum area.
- Click OK to run the tool. Note that the default symbology for the stream network is a single line.
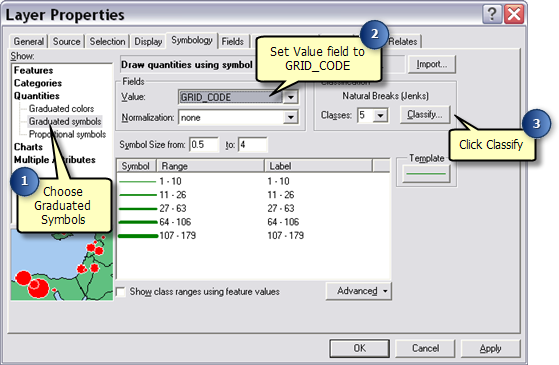
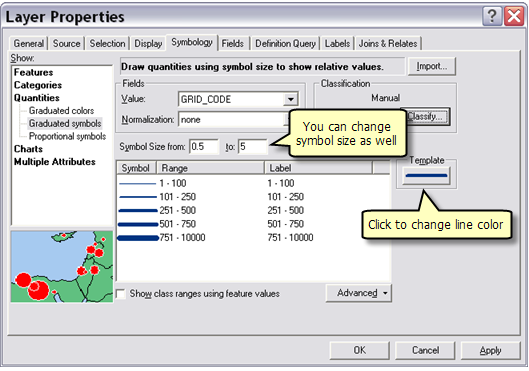
In the steps below, you will change the symbology to graduated line symbols. Right-click the Stream Network sublayer and click Properties, then click the Symbology tab.
- Click Graduated symbols found beneath the Quantities category.
- Choose GRID_CODE as the value field.
- Click Classify.
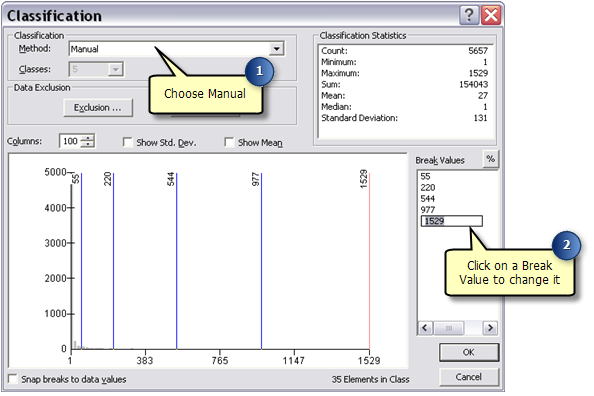
- In the Classification dialog box, choose Manual as the classification method.
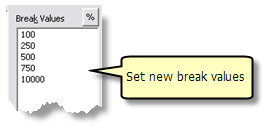
- You will set up a manual classification with breaks of 100, 250, 500, 750, and 10000. In the Break Values panel, click on the last value in the list. This will allow you to edit the value. Enter one of the break values, such as 10000. The list will refresh so that the values are sorted.
 Continue editing and setting the break values until the list appears as illustrated below.
- Click OK.
- The Symbology tab should now look as illustrated below. You may need to reset the color to blue by clicking Template and choosing a suitable blue color.
- Click OK.
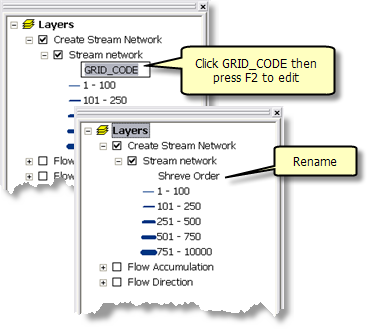
- The legend for the Stream Network sublayer displays GRID_CODE as the classification field, which will not make much sense to the user of your service. To change it, click GRID_CODE in the legend, press the F2 key, and change the text to something more descriptive such as Shreve Order or Stream Order. These steps are illustrated below.
StoweHillshade.mxd is published as a map service.
StoweStreamNet.mxd is published as a geoprocessing service with a result map service, as follows:
- In ArcCatalog, right-click StoweStreamNet.mxd and click Publish to ArcGIS Server.
- Accept all defaults.
Learn more about publishing geoprocessing services with a result map document
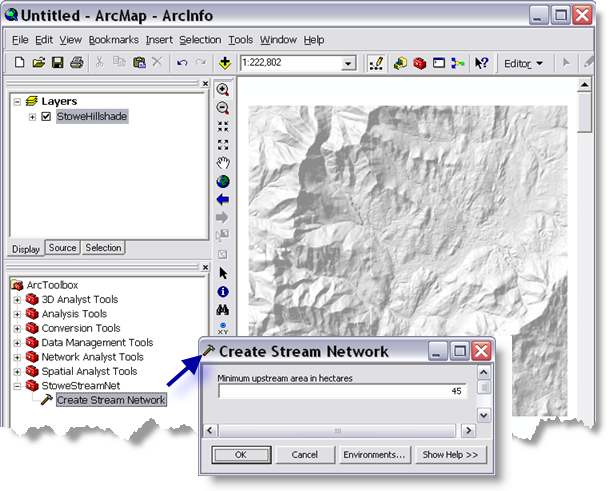
To use the services, start ArcMap and add the StoweHillshade map service and the StoweStreamNet geoprocessing service. Do not add the StoweStreamNet map service since this is a result map service and contains the Flow Accumulation and Flow Direction layers, which have nothing to do with results.
The illustration below shows ArcMap with these services.


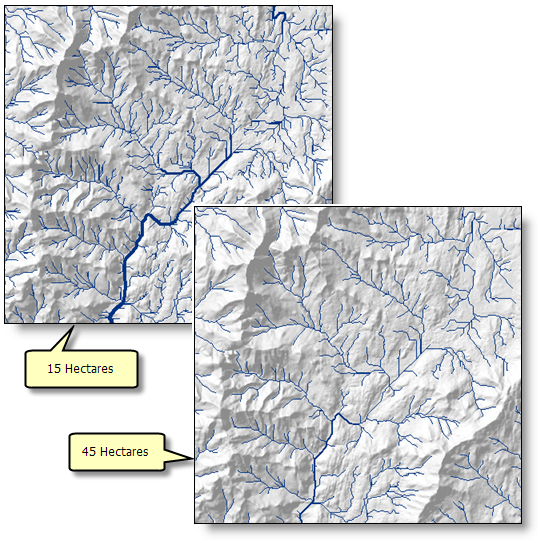 The task creates a stream network defined by a minimum area—the smaller the area, the more stream segments are produced. Each stream segment is assigned a stream order value based on the number of upstream stream segments, and this value is used to determine the line thickness to display each stream segment. The number of stream segments produced depends on the minimum area used. Using an input of 1 hectare, approximately 32,000 stream segments are produced. For 45 hectares, approximately 600 stream segments are produced. If you were to substitute your own data in the service (a state or province, for example), far more stream segments could be produced.
One of the decisions that you make when creating a geoprocessing service is determining the maximum number of records and features that can be returned from the server to the client. The default is 500 and you can increase this to billions. However, transporting large numbers of features across the Web is expensive and slow. Whenever you have a service that may output a large number of features, you should consider using a result map service to create a map of the result and let ArcGIS Server transport the map across the Web instead of the features. Because the number of stream segments produced by Create Stream Network task is dependent on the minimum drainage area and, if you substitute your own data, the size and topography of the study area, this example uses a result map service to draw the results instead of transporting the features across the Web to the client.
The task creates a stream network defined by a minimum area—the smaller the area, the more stream segments are produced. Each stream segment is assigned a stream order value based on the number of upstream stream segments, and this value is used to determine the line thickness to display each stream segment. The number of stream segments produced depends on the minimum area used. Using an input of 1 hectare, approximately 32,000 stream segments are produced. For 45 hectares, approximately 600 stream segments are produced. If you were to substitute your own data in the service (a state or province, for example), far more stream segments could be produced.
One of the decisions that you make when creating a geoprocessing service is determining the maximum number of records and features that can be returned from the server to the client. The default is 500 and you can increase this to billions. However, transporting large numbers of features across the Web is expensive and slow. Whenever you have a service that may output a large number of features, you should consider using a result map service to create a map of the result and let ArcGIS Server transport the map across the Web instead of the features. Because the number of stream segments produced by Create Stream Network task is dependent on the minimum drainage area and, if you substitute your own data, the size and topography of the study area, this example uses a result map service to draw the results instead of transporting the features across the Web to the client.