Performing diagnostics on Linux/Solaris


Performing diagnostics on Linux/Solaris |
|
| Release 9.3 |
|
The diagnostics check provides valuable information on the state of ArcGIS Server. It is a tool -
You can run this tool to determine if ArcGIS Server was successfully configured for your system. This tool can be run in ArcGIS Server Manager or through command line on your Linux/Solaris machine.
In ArcGIS Server Manager, click on the GIS Server --> Diagnostics link on the left side of the page.
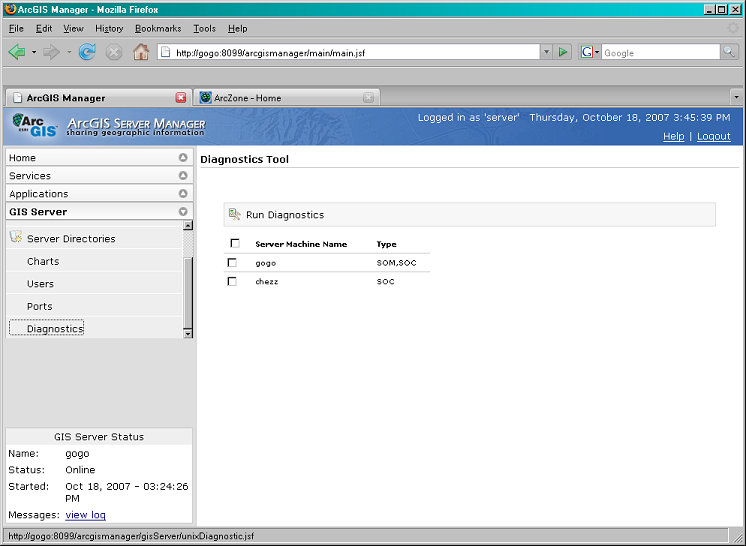
It lists the SOM machine and all the SOC machine(s). Select the machine that you would like to diagnose and click "Run Diagnostics". See Interpret ArcGIS Server Diagnostics test results. for the result.
Note: The server diagnostics tool assumes that ArcGIS Server Monitor is running on the hosts you want to run the diagnostics tool against. To start the Monitor, execute the following script on each of those hosts: <ArcGIS Server Installation directory>/arcgis /scripts/startmonitor. Check How does the Diagnostics tool work? - through the Monitor Framework to learn about the monitor framework.
You can also run this diagnostics tool from the command line. Running from command line allows you to run it on local or remote machine(s) (e.g. SOC-only install machines) and run it on a scheduled basis.
The script is installed under <ArcGIS Server Installation Directory>/arcgis/scripts/Server_diag_tool. You need to run this script as ArcGIS Server Install owner - the user who owns ArcGIS Server installation directory. You can run it in three modes.
Note: The server diagnostics tool assumes that ArcGIS Server Monitor is running on the hosts you want to run diagnostics tool against. To start the Monitor, execute the following script on each of those hosts: <ArcGIS Server Installation directory>/arcgis /scripts/startmonitor. Check How does the Diagnostics tool work? - through the Monitor Framework to learn about the monitor framework.
% ./Server_diag_tool
% ./Server_diag_tool --silent
Runs the diagnostic tool ONLY on the LOCAL host from a terminal.
% ./Server_diag_tool --remote <HOSTNAME-1> <HOSTNAME-2>...<HOSTNAME-N>
The following is the information and explanation about all the checks performed by the diagnostics tool. All the diagnostics checks are grouped with a code formated "DGXXX" according to the part of ArcGIS Server it checks.
The /etc/hosts file should contain an entry for the localhost. If this entry does not exist, this check will fail.
This verifies if the loopback IP address for localhost is set to 127.0.0.1. An example is as follows:
127.0.0.1 localhost
This verifies if the /etc/hosts file has an entry for ArcGIS Server hostname.
This will fail if the IP address for the hostname is set to the loopback address. It is required that the hostname entry in the /etc/hosts has a valid IP address. Example:
10.14.912.5 gogo.esri.com gogo
The OS user is created by ArcGIS Server setup at the time of install. Example:
DG005 - check /etc/passwd: user agsadmin
DG005 - check /etc/passwd: user agsuser
This verifies if <ArcGIS Server Installation directory>/arcgis is owned as ArcGIS Server install owner.
The installation directory should have at least 711 privilege (drwx--x--x) for ArcGIS Server owner.
This verifies if the disk space usage for ArcGIS Server installation directory is not 100%.
The <ArcGIS Server Installation directory>/arcgis/servercore/tmp/mw directory is used periodically to store temporary files. This check validates the presence of this directory.
This verifies if the user that owns ArcGIS Server has write permissions to the <ArcGIS Server Installation directory>/arcgis/servercore/tmp/mw directory
This verifies if the disk space usage for <ArcGIS Server Installation directory>/arcgis/servercore/tmp/mw is not 100%.
This verifies if the file or directory is owned as ArcGIS Server install owner. Examples:
DG012 - check /etc/remotesa: owner
DG012 - check /etc/remotesa/remotesa.config: owner
This verifies if the <file or directory> has the right permissioins. Examples:
DG013 - check /etc/remotesa: permissions
This verifies if /etc/remotesa folder has 700 (drwx------) permission.
DG013 - check /etc/remotesa/remotesa.config: permissions
This verifies if /etc/remotesa/remotesa.config file has 700 (-rwx------) permission.
This check will fail if something is wrong with the Server.dat file (for example, if Server.dat is missing) and the diag tool is unable to perform the DG015 checks.
The diagnostics check obtains the list of all server directories from <ArcGIS Server Installation directory>/arcgis/server/system/Server.dat and validates the existence of each directory. Example:
DG015 - check <ArcGIS Server Installation directory>/arcgis/server/serverdir/arcgisoutput
DG015 - check <ArcGIS Server Installation directory>/arcgis/server/serverdir/arcgisjobs
DG015 - check <ArcGIS Server Installation directory>/arcgis/server/serverdir/arcgiscache
This verifies that the Registry used by ArcGIS Server contains the necessary entries for the location and type of installation. These entries are created by the Setup program.
This verifies that the Registry used by ArcGIS Server core contains the necessary entries for the location and type of installation. These entries are created by the Setup program.
This verifies if the Core Services are running. The Core Services form the interop layer for ArcGIS Server and their role is critical to the functioning of ArcGIS Server.
This verifies if the Core Services are using a fixed port 135 for Remote Procedure Calls( RPC).
This verifies if the core service is running in Enterprise mode.
This verifies if the core service's administrator is ArcGIS Server install owner.
This verifies if the security authentication type for the Core Services is set correctly
This verifies if the port the security process is running on - 3774 - is correct.
This verifies if the Domain name used by the Core Service security mechanism is same as the host name.
This verifies if the DomainServer name used by the Core Service security mechanism is same as the host name. Both Domain name and Domain server specify the host where the Identity Server (for ArcGIS Server) is running.
This verifies if the secondary DomainServer name used by the Core Service security mechanism is set. This is for setting up SOM failover. If it's not set, ArcGIS Server will still function properly. The diagnostics tool just gives a [WARNING] message.
This verifies if the process started by ArcGIS Server is running. ArcGIS Server won't function properly if the process is not running. Example:
DG027 - check process: mwrpcss
This verifies if the process "mwrpcss" which represents the "RPC Server" is running. ArcGIS Server framework is built on the DCOM technology that supports distribution of COM objects across different machines and communication between them. The mwrpcss process provides this support on Linux/Solaris.
DG027 - check process: regss
This verifies if the process "regss" which represents the "Registry Service" is running. The Registry Service is responsible for managing the registry data used by Core Services.
DG027 - check process: watchdog
This verifies if the process "watchdog" is running. Watchdog is part of the Core Services and is responsible for keeping "mwrpcss" and "regss" processes alive. If mwrpcss and/or regss processes terminate unexpectedly the watchdog will start them again immediately.
DG027 - check process: remotesa
This verifies if the Identification process (remotesa) is running. Identity Server provides authentication services for ArcGIS Server.
DG027 - check process: ns-slapd
This verifies if the Directory Server process (ns-slapd) is running. Directory Server is a repository for storing ArcGIS Server user accounts.
DG027 - check process: arcsom.exe
This verifies if the Server Object Manager (SOM) is running.
DG027 - check process: java -jar arcgis_manager
This verifies if ArcGIS Server Manager is running as ArcGIS Server install owner.
DG027 - check process: java/manager/service/tomcat/managerappserver
This verifies if the Tomcat server which hosts the deployed Web applications and Web services is running as ArcGIS Server install owner.
DG027 - check process: Xvfb
This verifies if Xvfb process is running.
DG027 - check process: java/manager/service/derby
This verifies if the java process required by ArcGIS Server Manager security is running.
This is an additional check for Directory Server to verify if it is listening on the port (MWR_LDAPPORT)as specified in the /etc/remotesa/remotesa.config file. This port is 62000 by default.
This verifies if the Server Object Manager executable (<ArcGIS Server Installation directory>/arcgis/bin/arcsom.exe) has been given Read, Write and Set-UserID (setuid) access rights.
To fix it if this check fails, as the install owner, run
This verifies if the Server Object Manager executable (<ArcGIS Server Installation directory>/arcgis/bin/arcsom.init) has been given Read, Write and Set-UserID (setuid) access rights.
To fix it if this check fails, as the install owner, run
This verifies if the Server Object Container executable (<ArcGIS Server Installation directory>/arcgis/bin/arcsoc.exe) has been given Read, Write and Set-UserID (setuid) access rights.
To fix it if this check fails, as the install owner, run
This verifies if the Server Object Container executable (<ArcGIS Server Installation directory>/arcgis/bin/arcsoc.init) has been given Read, Write and Set-UserID (setuid) access rights.
To fix it if this check fails, as the install owner, run
ArcGIS Server maps all its users to either one of the two OS accounts - "agsadmin" or "agsuser". This step verifies that ArcGIS Server user map file (<ArcGIS Server Installation directory>/arcgis/servercore/.Server/.arcgis_usermap) has at least three entries. By default, this file should have entries for ArcGIS Server users: "admin", "agsadmin" and "agsuser".
This verifies if ArcGIS Server install owner has at least Read and Write access to the user map file in this location: <ArcGIS Server Installation directory>/arcgis/servercore/.Server/.arcgis_usermap
This check will show when something is wrong with the Server.dat file (like Server.dat is missing) and the diag tool is unable to perform the DG036 checks.
The diagnostics tool obtains the list of all Server Machines (SOCs) from <ArcGIS Server Installation directory>/arcgis/server/system/Server.dat and verifies if each Server Machine is reachable.
The diagnostics tool obtains the list of all Server Machines (SOCs) from <ArcGIS Server Installation directory>/arcgis/server/system/Server.dat and verifies if ArcGIS Server on each of those machines is alive and listening on Port 135.
This verifies if the ports listed are being used by ArcGIS Server. If these ports are not available for ArcGIS Server, ArcGIS Server won't run properly. Example:
DG038 - check if port 8399 is listening
This verifies if the Tomcat server which hosts the deployed Web applications and Web services is listening on Port 8399.
DG038 - check if port 8309 is listening
This verifies if the AJP/1.3 Connector is listening on Port 8309.
DG038 - check if port 8099 is listening
This verifies if the Tomcat server which hosts ArcGIS Server Manager is listening on Port 8099.
DG038 - check if port 8109 is listening
This verifies if the AJP/1.3 Connector is listening on Port 8109.
DG038 - check if port 8621 is listening
This verifies if ArcGIS Server security is listening on Port 8621.
This verifies if LDAP server has the correct storage scheme. If this check fails, run the <ArcGIS Server installtion directory>/arcgis/scripts/ServerConfig script as superuser to fix it.
This verifies if the password to access LDAP server is valid. If this check fails, run the <ArcGIS Server Installation directory>/arcgis/servercore/tools/ldap/setldappwd.sh script to fix it.
This verifies if the Server.dat file exists. This file should be under <ArcGIS Server installtion directory>/arcgis/server/system directory. With a SOM only install, this file will be generated after you add a SOC machine to the system.
This verifies if the security.xml file - for ArcGIS Server security configuration - exists. This file is installed at <ArcGIS Server Installation directory>/arcgis/java/manager/service/lib/security.xml
This verifies if the IP address for the hostname entry in /etc/hosts file is correct.
This verifies if the locale that the Server is running in matches the local environment of the operating system.
This check gives a [WARNING] if the <path to the jobs directory> exceends 30 characters. You can define this path in ArcGIS Server Manager by clicking GIS Server --> Server Directories. The default path is <ArcGIS Server installation directory>/arcgis/server/serverdir/arcgisjobs. If this path exceeds 30 characters, you might run into problems using gp tool with grids and coverages. For detail information, check Creating tasks for the UNIX/Linux environment
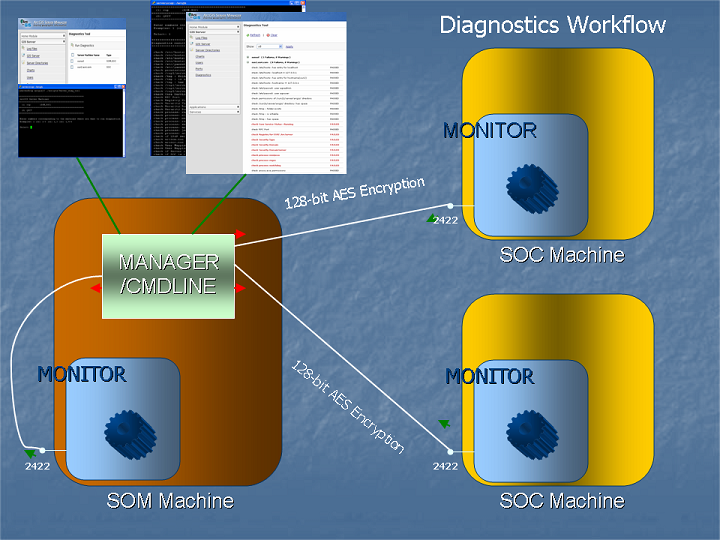
The Diagnostics tool is suppported by the Monitor framework. The Monitor is a standalone program that runs on all ArcGIS Server machines as a background process. It must be running for diagnostic tools to function. The scripts to start/stop monitor are installed under the <ArcGIS Server Installation directory>/arcgis/scripts folder and are called startmonitor/stopmonitor.
Monitor can be started/stopped by running
When ArcGIS Server is started by running <ArcGIS Server Installation directory>/arcgis/scripts/startserver, this script will check if the monitor is already running. If not, this script will start the monitor.
Running <ArcGIS Server Installation directory>/arcgis/scripts/stopserver will NOT stop montior process.
By default, Monitor is running on port 2422. This port number and other properties are set in <ArcGIS Server Installation directory>/arcgis/java/tools/monitor/monitor.xml file. The following user configurable peoperties can be modified in this file.
This property is used to specify the port number that the monitor uses to listen for incoming requests. The accepted range of port numbers is from 1024 to 65535. By default, the monitor uses port 2422.
This property is used to specify the level of information that the monitor produces and records in its log file. The log file is created at: <ArcGIS Server Installation directory>/arcgis/java/tools/monitor/logs/monitor.log. This file will be overwritten every time the monitor is started. The supported levels of log information are listed below in the increasing order of message importance:
FINE - records verbose messages that include the request XML received and the response XML returned.
INFO - records messages related to normal operation of the monitor. eg: a new client connection.
WARNING - records error messages that are not fatal.
SEVERE - records errors that require immediate attention.
If the monitor is configured to record INFO level messages, all WARNING and SEVERE messages will also be recorded, and so on. By default, the monitor is set at level INFO.
This property is used to specify the amount of time, in seconds, that the monitor waits for a request from a client before timing out. The default value is 120 seconds.
This property is used to specify the amount of time, in seconds, that the monitor waits for a response from a local program such as diagnostics before timing out. The default value is 120 seconds.
The timeout periods are set such that they don't need to be modified unless the network(in the case of SocketTimeout) or machines(in the case of ProcessTimeout) are extremely slow.