Adding North arrows, scale bars, and other map elements |
|
|
Release 9.1
Last modified December 7, 2006 |


|
About adding map elements
Some map elements are related to the data in data frames. North arrows, scale bars, scale text, and legends are examples of such elements.
Learn about other map elements such as titles; graphic elements, pictures, and neatlines; reports; and graphs.
North arrows indicate the orientation of the map.
Scale bars provide a visual indication of the size of features and distance between features on the map. A scale bar is a line or bar divided into parts and labeled with its ground length, usually in multiples of map units such as tens of kilometers or hundreds of miles. If the map is enlarged or reduced, the scale bar remains correct.
When you add a scale bar to a map, the number and size of the divisions might not be exactly as you would like them. For example, you might want to show four divisions rather than three or show 100 meters per division instead of 200. You might also want to change the units that the scale bar shows or adjust how those units are represented. You can adjust many characteristics of a scale bar from the Scale Bar properties dialog box.
When you add a scale bar to a map, the number labels and tick marks might not be exactly as you would like them. For example, you might want to label the endpoints of the scale bar but not the divisions, or you might want larger tick marks at the major divisions of the bar than at the minor ones.
You can also represent the scale of your map with scale text. Scale text indicates the scale of the map and of features on the map. Scale text tells a map reader how many ground units are represented by a map unit—for example, "one centimeter equals 100,000 meters."
Scale text can also be an absolute ratio independent of units, for example, "1:24,000". This means one unit on the map is equal to 24,000 of the same units on the ground. The advantage of absolute scale text is that map readers can interpret it with any units they want.
One drawback of scale text is that if a printed copy of the map is duplicated at another scale (i.e., enlarged or reduced), the scale text will be in error. Scale bars do not suffer this limitation. Many maps have both scale text and a scale bar to indicate the map scale.
A legend tells a map reader what the symbols used to represent features on the map mean. Legends consist of examples of the symbols on the map with labels containing explanatory text. When you use a single symbol for the features in a layer, the layer is labeled with the layer's name in the legend. When you use multiple symbols to represent features in a single layer, the field you used to classify the features becomes a heading in the legend and each category is labeled with its value.
Legends have patches that show examples of the map symbols. By default, the legend patches are points, straight lines, or rectangles that match the map symbols. You can customize the legend patches, for example, so areas are represented with patches of another shape or so rivers are drawn with a sinuous rather than a straight line.
Certain map elements—including scale bars, scale text, North arrows, legends, and data frames—can have frames. You can use frames to set map elements apart from other elements or from the background of the map. You can also use frames to visually link map elements to other parts of the map by using similar frames for related elements.
You might want to convert a map element, such as a legend, to graphics if you want more precise control over each element that comprises the element. Once you convert a map element to graphics, you can't reconstruct the map element from the individual pieces.
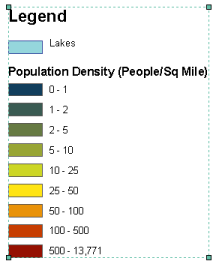
The image below shows a legend that has been converted to a grouped graphic.

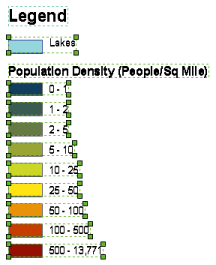
The image below shows the same legend; it has been ungrouped so that the individual graphics that comprise the legend can be edited separately.

How to add map elements
Adding a North arrow
- Click the Insert menu and click North Arrow.
- Click a North arrow.
- Click OK.
- Click and drag the North arrow into place on your map. Optionally, resize the North arrow by clicking and dragging a selection handle.
| Tip |
|
Adding a scale bar
- Click the Insert menu and click Scale Bar.
- Click a scale bar. Optionally, click Properties to modify the scale bar's properties.
- Click OK.
- Click and drag the scale bar into place on your map. Optionally, resize the text on the scale bar by clicking and dragging a selection handle.
| Tip |
|
Customizing a scale bar's scale and units
- Right-click the scale bar and click Properties.
- Click the Scale and Units tab.
- Click the arrow buttons to set the number of divisions.
- Click the arrow buttons to set the number of subdivisions.
- Click the When resizing dropdown arrow and click how you want the scale bar to respond when the map scale changes. Adjust division value—the division value will vary with the map scale. The number of divisions and the width of the scale bar remain constant. Adjust number of divisions—the number of divisions will vary with the map scale. The division value and the width of the scale bar remain constant. Adjust width—the width of the scale bar will vary with the map scale. The division value and number of divisions remain constant.
- Choose the units for the scale bar.
- Click Symbol and choose a text style for the scale bar labels.
- Click OK.
| Tips |
|
Customizing a scale bar's numbers and marks
- Right-click the scale bar and click Properties.
- Click the Scale and Units tab.
- Click the Numbers Frequency dropdown arrow to choose where along the bar to place the numbers.
- Click the Numbers Position dropdown arrow to choose where to place numbers relative to the bar.
- Click the Marks Frequency dropdown arrow to choose where along the bar to place tick marks.
- Click the Marks Position dropdown arrow to choose where to place tic marks relative to the bar.
- Click the Division Height arrow buttons to increase or decrease the height of division tick marks.
- Click the Subdivision Height arrow buttons to increase or decrease the height of subdivision tick marks.
- Click OK.
Adding scale text
- Click the Insert menu and click Scale Text.
- Click a sample of the style of scale text to add to the map. Optionally, click Properties to customize the scale text.
- Click OK.
- Click and drag the scale text into position on your map. Optionally, set a specific font size for the scale text by choosing a font size from the font size dropdown list on the Draw toolbar.
| Tip |
|
Adding a legend
- Click the Insert menu and click Legend. The Legend Wizard appears. If this wizard doesn't appear, wizards have been turned off. When wizards have been turned off, a default legend will be immediately added to your layout. You can double-click this legend to change its properties. If you'd prefer to use the Legend Wizard when you insert a legend, you need to turn wizards back on. Click Options from the Tools menu and click the General tab in the dialog box that appears. Check the Show Wizards when available box.
- To remove a legend item, click it, then click the left arrow button. By default, all the layers on the map will appear as legend items in the legend.
- Use the Up and Down arrow buttons to order the legend items.
- Click Next.
- Type a title for the legend.
- Set the text color, font, and size as desired and click Next.
- Click the Border dropdown arrow and click a border.
- Click the Background dropdown arrow and click a background.
- Click the Drop Shadow dropdown arrow and click a drop shadow.
- Click Next.
- Click a Legend Item in the list to modify the symbol patch.
- Set the Patch properties as desired and click Next.
- Set the spacing between legend elements by typing a value into the appropriate box.
- Click Finish.
| Tips |
|
Changing the patches in a legend
- Right-click the legend on the map and click Properties.
- Click the Legend tab.
- Click the dropdown arrow to select a new patch shape.
- Click OK.
| Tip |
|
Changing the patches in a legend that has transparent symbols
- If you know the opaque color values of your transparent symbols, you can start at step 5.
- Click Tools on the Main menu and click Customize.
- Click the Commands tab and click Page Layout.
- Click the Eye Dropper tool
 from the Commands list and drag and drop it onto a toolbar, then close the Customize dialog box.
 - Click the Eye Dropper tool
 and click a polygon feature in the data frame. The Color dialog box displays the color name in Red, Green, Blue combination and the displayed color is saved to the color palette.
 - Click the Select Elements tool
 in layout view.
 - Right-click the legend and click Convert to Graphics.
- Click Drawing on the Draw toolbar and click Ungroup. Repeat Ungroup until the legend patches and text are completely ungrouped.
- Click the legend patch you want to change. The patches are now simple graphics.
- Click the Fill Color button
 on the Draw toolbar to open the color palette.
 - Click the recently saved color in the color palette to apply it to the legend patch.
NOTE: The legend is now a graphic and is no longer linked to the data frame.
| Tips |
|
Changing the items in a legend
- Right-click the legend on the map and click Properties.
- Click the Items tab.
- Click a legend item in the Legend Items list.
- Click the up and down arrows to move the item up or down in the legend. Optionally, click Style and change the item's style in the legend, or check Place in new column to place the item in a new column, or change the number of columns for the selected legend item by clicking the up and down arrow keys, or remove an item from the legend by clicking it and clicking the left arrow key.
- Click OK.
| Tip |
|
Framing a map element
- Right-click the element on the map and click Properties.
- Click the Frame tab.
- Click the Border dropdown arrow and click a border.
- Click the Background dropdown arrow and click a background.
- Click the Drop Shadow dropdown arrow and click a drop shadow.
- Click OK.
| Tips |
|
Converting map elements to simple graphics
- Right-click an element and click Convert to Graphics. The element is now a grouped graphic.
- Right-click the graphic and click Ungroup. The individual graphics that comprise the map element can now be edited separately.