GIS data structure types |
|
|
Release 9.1
Last modified April 29, 2005 |


|
ArcGIS stores and manages geographic data in a number of formats. The three basic data models that ArcGIS uses are vector, raster, and TIN. You can also import tabular data into ArcGIS.
Vector data models represent geographic phenomena with points, lines, and polygons.
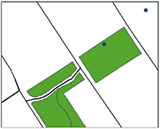
Points are pairs of x,y coordinates, lines are sets of coordinate pairs that define a shape, and polygons are sets of coordinate pairs defining boundaries that enclose areas.
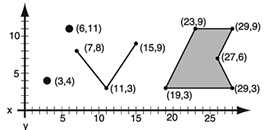
Coordinates are usually pairs (x,y) or triplets (x,y,z, where z represents a value such as elevation). The coordinate values depend on the geographic coordinate system in which the data is stored.
ArcGIS stores vector data in feature classes and collections of topologically related feature classes. The attributes associated with the features are stored in data tables.
ArcGIS uses three different implementations of the vector model to represent feature data: coverages, shapefiles, and geodatabases.
Vector data models are useful for representing and storing discrete features such as buildings, pipes, or parcel boundaries.
Learn more about the structure of vector datasets in ArcGIS
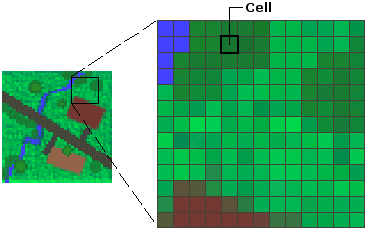
A raster model, otherwise known as a raster dataset (image), is, in its simplest form, a matrix (grid) of cells.
Learn more about the raster data model
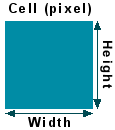
Cell size
Each cell has a width and height and is a portion of the entire area represented by the raster. The dimension of the cells can be as large or as small as necessary to represent the area and the features within the area, such as a square kilometer, square meter, or even square centimeter. The cell size determines how coarse or fine the patterns or features in your extent will appear. The smaller the cell size, the more detail the area will have. However, the greater the number of cells, the longer it will take to process, and it will require more storage space. If a cell size is too large, information may be lost or subtle patterns may be obscured.
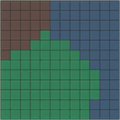
Choosing an appropriate cell size in not always simple. You must balance your application's need for resolution with practical requirements for quick display, processing time, and storage. Essentially, in a GIS, your results will only be as accurate as your least accurate dataset. If you're using a classified dataset derived from 30 meter resolution Landsat imagery, then creating a digital elevation model (DEM) or other ancillary data at a higher resolution, such as 10 meters, may be unnecessary. Below is an example of the same spatial area represented by two different cell sizes.
Resolution vs. scale
The resolution of a raster dataset refers to the cell size or area covered on the ground and represented by a single cell. Therefore, if the area covered by a cell is 5 x 5 meters, the resolution is 5 meters. The higher the resolution, the smaller the cell size and the greater the detail. This is opposite for scale.
Cell location
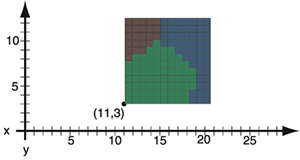
The location of each cell is defined by its row or column location within the raster matrix. Essentially, the matrix is represented by a Cartesian coordinate system, where the rows of the matrix are parallel to the x-axis and the columns to the y-axis of the Cartesian plane. The x,y coordinates of at least one corner of the raster dataset must be known so it can be located in geographic space.
Georeferencing assigns coordinates from a known reference system, such as latitude/longitude, Universal Transverse Mercator (UTM), or State Plane, to the page coordinates of a raster (image) or a planar map. Georeferencing raster data allows it to be viewed, queried, and analyzed with other geographic data.
Learn more about georeferencing raster datasets
Cell value
Each cell has a value. This value represents the phenomenon portrayed by the raster dataset, such as a category, magnitude, distance, or spectral value. The category could refer to a land use class, such as grassland or urban. A magnitude could represent gravity, noise pollution, or percent of rainfall. Distance could represent elevation, which could be converted to represent slope or used to perform a line of sight or watershed analysis. Spectral values or values representing color exist in imagery and photography, such as those obtained through satellite imaging, aerial photography, or a handheld digital camera.
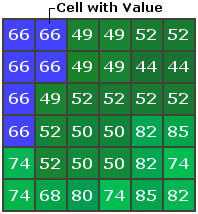
Cell values can be positive or negative, integer or floating-point, or even have a NODATA value to represent the absence of data.
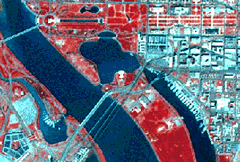
Below is an example of a raster dataset image (a high-resolution spectral view of Washington, D.C.).
Advantages of the raster model
- A simple data structure—a matrix of cells with values, representing a coordinate, and sometimes linked to an attribute table.
- A powerful format for intense statistical and spatial analysis.
- The ability to represent continuous surfaces and perform surface analysis.
- The ability to uniformly store points, lines, polygons, and surfaces.
- Capability to perform faster overlays (than vector datasets) with complex data.
- The same cell-based structure is used to represent all feature types; therefore, all feature types may be treated the same. This uniform structure allows you to combine a variety of geographic features in one geoprocessing operation (for example, query, overlay, or expression). You can combine a surface (elevation) with area features (forestry), linear features (rivers and roads), and point features (wells) in the same analysis.
- The ability to compress the datasets using either a lossy or lossless compression.
Disadvantages of the raster model
- Inherent spatial inaccuracies due to the cell-based feature representation.
- Datasets can be very large.
ArcGIS can recognize and use raster datasets in many different formats. You can add raster datasets to a map just as you would features, and you can inspect and organize them with ArcCatalog.
Learn more about working with raster datasets in ArcCatalog
Learn more about working with raster datasets in ArcMap
TIN
In a triangulated irregular network (TIN) model, the world is represented as a network of linked triangles drawn between irregularly spaced points with x, y, and z values. TINs are an efficient way to store and analyze surfaces.
Heterogeneous surfaces that vary sharply in some areas and less in others can be modeled more accurately, in a given volume of data, with a triangulated surface than with a raster. That is because many points can be placed where the surface is highly variable, and fewer points can be placed where the surface is less variable. In using only the points necessary, TINs also provide a more efficient method to store data. ArcGIS stores triangulated surfaces as TIN datasets. As with rasters, you can add TIN datasets to a map in ArcMap and manage them with ArcCatalog.
You can think of a GIS as a database that understands geometry. Like other databases, ArcGIS lets you link tables of data together. Just about any table of data can be joined to an existing feature class or raster dataset if they share an attribute. For example, you may have a shapefile of census tracts with a tract number field and a tabular file of additional census data also containing a tract number field. You can link the census data to the shapefile’s attribute table and map the additional data.
Geocoding is another means of getting tabular data on a map. Perhaps the simplest example of geocoding is plotting points based on tables of geographic coordinates. For example, you can plot the locations of soil samples based on latitude and longitude values obtained from a global positioning system (GPS) receiver. You can also plot points by geocoding tables of addresses on an existing street network.
Learn more about tabular data in ArcGIS