Data support in ArcGIS > Raster data > Designing a raster database
BIL, BIP, and BSQ raster files |
|
|
Release 9.2
Last modified September 22, 2008 |


Print all topics in : "Designing a raster database" |
Band interleaved by line (BIL), band interleaved by pixel (BIP), and band sequential (BSQ) are three common methods of organizing image data for multiband images. BIL, BIP, and BSQ are not in themselves image formats but are schemes for storing the actual pixel values of an image in a file. These files support the display of single and multiband images and handle black-and-white, grayscale, pseudo color, true color, and multispectral image data.
The BIL, BIP, and BSQ files are binary files, and they must have an associated ASCII file header to be interpreted properly by ArcGIS. This header file contains ancillary data about the image such as the number of rows and columns in the image, if there is a color map, and latitude and longitude.
Band interleaved by line data stores pixel information band by band for each line, or row, of the image. For example, given a three-band image, all three bands of data are written for row 1, all three bands of data are written for row 2, and so on, until the total number of rows in the image is reached. The following diagram illustrates BIL data for a three-band dataset:
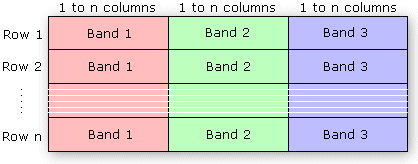
See an example of a BIL file
Band interleaved by pixel data is similar to BIL data, except that the data for each pixel is written band by band. For example, with the same three-band image, the data for bands 1, 2, and 3 are written for the first pixel in column 1; the data for bands 1, 2, and 3 are written for the first pixel in column 2; and so on.
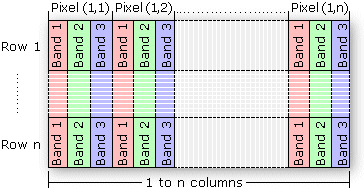
See an example of a BIP file
Band sequential format stores information for the image one band at a time. In other words, data for all the pixels for band 1 is stored first, then data for all pixels for band 2, and so on.
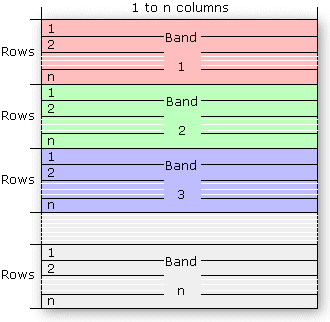
See an example of a BSQ file
Image description files
There are three description files that can be provided with BIL, BIP, or BSQ files: a header file (hdr) that describes the layout of the image pixel data and must be provided, a color file (clr) that describes the image color map, and a statistics file (stx) that describes image statistics for each band of the image. These ASCII text files can be generated in a text editor using the information you know about the image.
The header file
The header file describes the image data. You must generate a header file for each image, and it should have the same file name with a .hdr extension, for example:
<image>.hdr
The header file contains a set of entries, each of which describes a particular attribute of the image. For example, an entry can describe the number of rows or columns in the image. The format of each entry is
<keyword> <value>
in which <keyword> indicates the particular attribute that is being set, and <value> is the value to which the attribute is being set. The entries in the header can be in any order, but each must be on a separate line of the file. Any line in the file that does not begin with a keyword is treated as a comment and ignored.
The following list identifies the valid keywords and describes the particular image attribute they define. Several of the keywords have default values. Where the default value accurately represents the image data, you can omit the keyword from the header file.
nrows—The number of rows in the image. Rows are parallel to the x-axis of the map coordinate system. There is no default.
ncols—The number of columns in the image. Columns are parallel to the y-axis of the map coordinate system. There is no default.
nbands—The number of spectral bands in the image. The default is 1.
nbits—The number of bits per pixel per band. Acceptable values are 1, 4, 8, 16, and 32. The default value is 8 bits per pixel per band. For a true color image with three bands (R,G,B) stored using 8 bits for each pixel in each band, nbits equals 8 and nbands equals 3 for a total of 24 bits per pixel. For an image with nbits equal to 1, nbands must also equal 1.
byteorder—The byte order in which image pixel values are stored. The byte order is important for 16-bit images with two bytes per pixel. Acceptable values are:
- I—Intel byte order (Silicon Graphics, DEC Alpha, PC)—also known as little-endian
- M—Motorola byte order (Sun, HP, etc.)—also known as big-endian
The default byte order is the same as that of the host machine executing the software.
layout—The organization of the bands in the image file. Acceptable values are:
- bil—band interleaved by line. This is the default.
- bip—band interleaved by pixel.
- bsq—band sequential.
skipbytes—The number of bytes of data in the image file to skip to reach the start of the image data. This keyword allows you to bypass any existing image header information in the file. The default value is 0 bytes.
ulxmap—The x-axis map coordinate of the center of the upper left pixel. If you specify this parameter, set ulymap, too; otherwise, a default value is used.
ulymap—The y-axis map coordinate of the center of the upper left pixel. If this parameter is specified, ulxmap must also be set; otherwise, a default value is used.
xdim—The x-dimension of a pixel in map units. If this parameter is specified, ydim, ulxmap, and ulymap must also be set; otherwise, a default value is used.
ydim—The y-dimension of a pixel in map units. If this parameter is specified, xdim, ulxmap, and ulymap must also be set; otherwise, a default value is used.
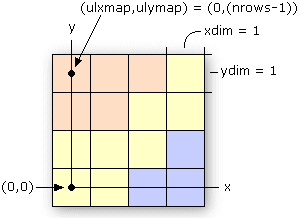
The following figure shows the default values for ulxmap, ulymap, xdim, and ydim. The center of the upper left pixel will have map coordinates (ulxmap, ulymap) = (0, (nrows - 1)), with the center of the lower left pixel at (0, 0). In this figure, the coordinate value for ulxmap and ulymap is (0, 3). The x- and y-pixel dimensions will default to xdim = 1 and ydim = 1.
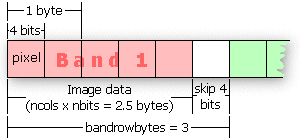
bandrowbytes—The number of bytes per band per row. This must be an integer. This keyword is used only with BIL files when there are extra bits at the end of each band within a row that must be skipped. Bandrowbytes can be thought of as an index to the starting point of the next band of data. Starting at the beginning of any band in a row, moving bandrowbytes along that row leads to the beginning of the next band.
The figure below illustrates one row of data for a three-band image. Bandrowbytes is the sum of the number of bytes used to store the image data and the extra bits that must be skipped to reach the next band.
bandrowbytes = image data + extra bits

To set bandrowbytes, you must know the layout of the image data or, more specifically, how many bytes are used to store pixel values for each band in a row. If bandrowbytes is not specified, a default value is calculated with the following equation:
bandrowbytes = the smallest integer(ncols x nbits) / 8
The default value handles cases when there are no extra trailing bits at the end of each band in a row and when the number of bytes per band per row is the smallest integer number of bytes that will adequately store the data for the band; for example, if the data requires 2.5 bytes, 3 bytes is the smallest integer number of bytes that could store the data. In these two cases, bandrowbytes does not need to be set. If, however, the number of bytes per band per row is greater than the default, set bandrowbytes accordingly.
The following two examples show the default behavior of bandrowbytes. The first example describes the case for which there are no trailing bits at the end of a band in a row, and the second describes the case for which there are.
- If there are no extra trailing bits at the end of a band, bandrowbytes equals the number of bytes used to store the image data.
bandrowbytes = image data

For example, given a 6-by-6 image with three bands and 8 bits (1 byte) per pixel, the image data will require 6 bytes per band per row.
bytes per band per row = ncols x nbits
= 6 x 8
= 48 bits or 6 bytes
By default, bandrowbytes is set to 6 bytes, as shown by the following equation:
bandrowbytes = (ncols x nbits) / 8
= (6 x 8) / 8
= 48 / 8
bandrowbytes = 6 bytes
Because the number of bytes per band per row equals bandrowbytes, the default value is the appropriate setting. Thus, bandrowbytes does not need to be explicitly specified.
Suppose you have a three-band image of 5 rows and 5 columns with 4 bits per pixel. By default, bandrowbytes is set to the smallest integer number of bytes that will adequately hold the data. In this case, the default value is 3. This is calculated as follows:
bandrowbytes = (ncols x nbits) / 8
= (5 x 4) / 8
= 20 / 8
= 2.5
= 3 (when rounded up to the nearest integer)
The image data, however, only requires 2.5 bytes, which is calculated by multiplying ncols by nbits. Thus, the number of bytes that will be skipped is .5 bytes (4 bits), or the difference between 3 bytes (bandrowbytes) and 2.5 bytes (image data bytes). The figure below shows one band of data for one row of the image.
totalrowbytes—The total number of bytes of data per row. Use totalrowbytes when there are extra trailing bits at the end of each row.

For a BIL file, the default value for totalrowbytes is calculated with the following equation:
totalrowbytes = nbands x bandrowbytes
The default value assumes that there are no extra trailing bits at the end of each row. If there are, set totalrowbytes accordingly. For example, given a three-band image with bandrowbytes equal to 3, totalrowbytes will equal 9 by default. If there is an extra trailing byte of data at the end of the row, set totalrowbytes to 10.
For a BIP file, the default value is calculated with a different equation:
totalrowbytes = (ncols x nbands x nbits) / 8
Totalrowbytes is rounded up to the nearest integer number of bytes that can adequately store the pixel data for the row. For example, given a 5 (rows) by 5 (columns) BIP image with 3 bands and 4 bits per pixel, the default value for totalrowbytes is:
totalrowbytes = (ncols x nbands x nbits) / 8
= (5 x 3 x 4) / 8
= 60 / 8
= 7.5
= 8 (when rounded up to the nearest integer)
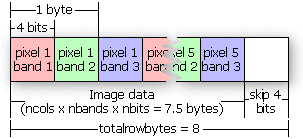
This figure illustrates the default setting of totalrowbytes for a BIP image.
If the default value for totalrowbytes does not accurately represent the layout of the data, totalrowbytes must be set to the appropriate number of bytes in each row.
bandgapbytes—The number of bytes between bands in a BSQ format image. The default is 0.
The following is a typical header file that might be generated for a band interleaved by line satellite image where the image data is preceded by a 128-byte header.
Sample BIL header file
Lines that don't begin with a keyword are treated as comments.
nrows 1024  Comments can be placed here as well.
ncols 1024
nbands 3
nbits 8
layout bil
skipbytes 128
The following table gives a summary of the keywords that can be used in the .hdr file:
| Keyword | Acceptable Value | Default |
| nrows | any integer > 0 | none |
| ncols | any integer > 0 | none |
| nbands | any integer > 0 | 1 |
| nbits | 1, 4, 8, 16, 32 | 8 |
| byteorder | I = Intel;
M = Motorola |
same as host machine |
| layout | bil, bip, bsq | bil |
| skipbytes | any integer ≥ 0 | 0 |
| ulxmap | any real number | 0 |
| ulymap | any real number | nrows - 1 |
| xdim | any real number | 1 |
| ydim | any real number | 1 |
| bandrowbytes | any integer > 0 | smallest integer ≥ (ncols x nbits) / 8 |
| totalrowbytes | any integer > 0 | for bil: nbands x bandrowbytes;
for bip: smallest integer ≥ (ncols x nbands x nbits) / 8 |
| bandgapbytes | any integer ≥ 0 | 0 |
The color file
The color file (.clr) is an optional file that describes the image color map for single-band pseudo color images. If this file doesn’t exist, the image displays as a grayscale image.
The color file records the colors to be associated with pixel values in the image. Colors are defined using the RGB color model that describes colors in the amount of red, green, and blue they contain. The file consists of a set of entries, each on a separate line, that describes the color corresponding to a pixel value in the image.
Each entry has the format:
<value> <red> <green> <blue>
in which <value> is a given pixel value and <red>, <green>, and <blue> are the color components for the pixel. Sort all entries in ascending order by pixel value. If the first nonblank character on the line is not a number, the line is considered a comment and is ignored. Any nonblank characters in a line beyond the fourth parameter (blue) are ignored and may be used as comments as well.
The red, green, and blue components are described using a scale with values ranging from 0 to 255. As the color value increases, so does the intensity of the particular color component. The default color for a pixel value with no entry is black. A sample color file for a raster soils map with pixel values of 11, 16, 18, 19, 21, 98, and 99 is shown below:
Color file for Soils map
Entries are sorted in ascending order by pixel value.
 11 255 0 0 (red)
 16 255 165 0 (orange)
 18 255 255 0 (yellow)
 19 0 255 0 (green)
 21 0 0 255 (blue)
 98 0 255 255 (cyan)
 99 160 32 240 (purple)
Color files are only used with single-band images. Any single-band image with a color file will be interpreted as a pseudo color image. Color files that accompany multiband images are ignored.
The statistics file
The statistics file (.stx) is an optional file that describes image statistics for each spectral band in a grayscale or multiband image. The file consists of a series of entries, one for each band, that records the minimum pixel value, the maximum pixel value, the mean, the standard deviation, and two linear contrast stretch parameters.
Each entry has the format (all values appear on the same line in the file for each band):
<band> <minimum> <maximum> {mean} {std_deviation}
{linear_stretch_min} {linear_stretch_max}
in which <band> is the band number, <minimum> is the minimum pixel value in the band, <maximum> is the maximum pixel value in the band, {mean} is the mean pixel value, {std_deviation} is the standard deviation, {linear_stretch_min} is the minimum pixel value for a linear contrast stretch, and {linear_stretch_max} is the maximum pixel value for a linear contrast stretch.
The values for each parameter are entered on one line. Any entry in which the first nonblank character is not a number is treated as a comment and ignored. The band number and the minimum and maximum pixel values are required parameters; the mean, the standard deviation, linear stretch minimum value, and linear stretch maximum value are optional parameters. Use a "#" to skip the optional parameters.
Band numbers can range from 1 to nbands. The linear_stretch_min and linear_stretch_max parameters are used to expand the contrast of the displayed image. Pixel values less than linear_stretch_min are displayed in black, and pixel values greater than linear_stretch_max are displayed in white. The pixel values that fall between the minimum and maximum linear stretch parameters are displayed using shades of gray, with lower pixel values being displayed in darker shades of gray.
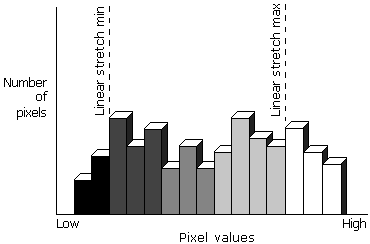
The pixel values that fall between the linear stretch parameters are displayed using the maximum number of gray shades available on the display device.
If linear_stretch_min and linear_stretch_max are not specified, they default to the mean minus two standard deviations for linear_stretch_min and the mean plus two standard deviations for linear_stretch_max. If the standard deviation is not given, the minimum and maximum pixel values are used as the contrast stretching parameters.
For multiband images, each band is stretched before the composite image displays. The presence of a color file (.clr) will override the linear contrast stretching of a single-band grayscale image and, instead, display the image as a pseudo color image.
The following is a sample statistics file for a four-band satellite image with 8 bits per pixel per band:
Image statistics file
1 2 118 67 10
Band 2 has linear contrast stretch parameters:
2 23 251 112 23 80 90
3 68 91 73 4
Band 4 does not contain values for mean and standard deviation:
4 126 198 # # 135 167