Geoprocessing tool reference > Spatial Statistics toolbox
Modeling spatial relationships |
|
|
Release 9.3
Last modified April 24, 2009 |


Print all topics in : "Spatial Statistics toolbox" |
Note:
This topic was updated for 9.3.1.
The tools in the Spatial Statistics toolbox allow the user to model spatial relationships in a variety of ways:
Conceptualization of spatial relationships
An important difference between spatial and traditional (a-spatial) statistics is that spatial statistics integrate space and spatial relationships directly into their mathematics. Consequently, many of the tools in the spatial statistics toolbox require the user to select a conceptualization of spatial relationships prior to analysis. Common conceptualizations include inverse distance, travel time, fixed distance, K nearest neighbors and contiguity. The conceptualization of spatial relationships you use will depend on what you are measuring. If you are measuring clustering of a particular species of seed-propagated plant, for example, inverse distance is probably most appropriate. However, if you are assessing the geographic distribution of a region's commuters, travel time or travel cost might be better choices for describing spatial relationships. For some analyses, space and time might be less important than more abstract concepts like familiarity (the more familiar something is, the more functionally near it is) or spatial interaction (there are many more phone calls, for example, between Los Angeles and New York than between New York and a smaller town nearer to New York, like Poughkeepsie—some might argue that Los Angeles and New York are functionally closer).
Note: whenever distance is a component of your analysis, which is almost always the case with spatial statistics, project your data using a Projected Coordinate System (rather than a Geographic Coordinate System based on degrees, minutes, seconds).
Inverse distance, inverse distance squared (impedance)

With Inverse Distance the conceptual model of spatial relationships is one of impedance, or distance decay. All features impact/influence all other features, but the farther away something is, the smaller the impact it has. Because every feature is a neighbor of every other feature, you will generally want to specify a cutoff distance/threshold to reduce the number of required computations with large datasets.
Inverse Euclidean distance is appropriate for modeling continuous data like temperature variations, for example. Inverse Manhattan distance might work best when analysis involves the locations of hardware stores or other fixed urban facilities and road network data isn't available. For inverse distance squared, the slope is sharper so influence drops off more quickly and only a target feature's closest neighbors will exert substantial influence in computations for that feature.
Distance band (sphere of influence)

For some tools, like Hot Spot Analysis, a fixed distance band is the default conceptualization of spatial relationships. With the fixed distance option, you impose a "sphere of influence" or moving window conceptual model of spatial relationships onto the data. Each feature is analyzed within the context of those neighboring features within some specified critical distance. Features outside the critical distance of a target feature do not influence calculations for that feature. Use the fixed distance method when you want to evaluate the statistical properties of your data at a particular spatial scale. If you are studying commuting patterns and know that the average journey to work is 15 miles, for example, you may want to use a 15 mile fixed distance for your analysis. See Selecting a Fixed Distance.
Zone of indifference

The Zone of Indifference option for conceptualization of spatial relationships combines the inverse distance and fixed distance band models. Features within the critical distance of a target feature are included in analyses for that feature. Once the critical distance is exceeded, the level of impact quickly drops off. Suppose you're looking for a job and have the choice between a job five miles away and another job six miles away. You probably won't think much about distance in making a decision about which job to take. Now, suppose you have the choice between one job five miles away and another 20 miles away. In this case, distance becomes more of an impedance and may be factored into your decision making. Use this method when you want to hold the scale of analysis fixed, but don't want to impose sharp boundaries on the neighboring features included in target feature analyses.
Polygon Contiguity (First Order)
For polygon feature classes you may choose first order contiguity. Polygons that share an edge (those with coincident boundaries) with a target polygon influence that polygon and are included in computations for that target polygon. Polygons that do not share a boundary do not exert influence and are not included in computations for the target polygon. This option is also referred to as Polygon Contiguity Edges Only. Polygon Contiguity Edges and Corners constructs neighbors from polygons that share either a boundary (edge) or a corner (node). Use one of these contiguity conceptualizations with polygon features in cases where you are modeling some type of contagious process or are dealing with continuous data represented as polygons. Note: The Polygon Contiguity options are only available with an ArcInfo license.
K Nearest Neighbors
Neighbor relationships may also be constructed so that each feature is assessed within the spatial context of a fixed number of its closest neighbors. If K (the number of neighbors) is 8, then the 8 closest neighbors to the target feature will be included in computations for that feature. In locations where feature density is high, the spatial context of the analysis will be smaller. Similarly, in locations where feature density is sparse, the spatial context for the analysis will be larger. An advantage to this model of spatial relationships is that it ensures there will be some neighbors for every target feature, even when feature densities vary widely across the study area.
Delaunay Triangulation (natural neighbors)
The Delaunay Triangulation option constructs neighbors by creating Voronoi triangles from point features or from feature centroids such that each point/centroid is a triangle node. Nodes connected by a triangle edge are considered neighbors. Using the Delaunay Trianglulation option ensures every feature will have at least one neighbor even when data includes islands and/or widely varying features densities.

Get spatial weights from file (user-defined spatial relationships)
You can also provide a pathname to a formatted ASCII text file that defines your own custom conceptualization of spatial relationships (based on spatial interaction, for example). If you want to define spatial relationships using travel time or travel costs derived from a Network dataset, create a spatial weights matrix file using the Generate Network Spatial Weights tool, then use the resultant .swm file for your analysis. Alternatively, you can construct a spatial weights matrix file using the Generate Spatial Weights Matrix tool. If the spatial relationships for your features are defined in a table, you can use the Generate Spatial Weights Matrix tool to convert that table into a spatial weights matrix file. Particular fields are required to convert a table to a .swm file.
Selecting a Conceptualization of Spatial Relationships: Best Practices
The more realistically you can model how features interact with each other in space, the more accurate your results will be. Your choice for the Conceptualization of Spatial Relationships parameter should reflect inherent relationships among the features you are analyzing. Sometimes your choice will also be influenced by characteristics of your data.
The inverse distance methods, for example, are most appropriate with continuous data or to model processes where the closer two features are in space, the more they interact/influence each other. With this spatial conceptualization, every feature is a neighbor of every other feature and with large datasets, the number of computations involved will be enormous. You should always try to include a threshold distance when using the inverse distance conceptualizations. This is particularly important for large datasets. If you leave the Distance Band/Threshold Distance parameter blank, a threshold distance will be computed for you. It will be the minimum distance that ensures every feature has at least one neighbor.
The fixed distance method works well for polygon data where there is a large variation in polygon size (very large polygons at the edge of the study area and very small polygons at the center of the study area, for example). Fixed distance is also recommended for point data when running Hot Spot Analysis. See Selecting a Fixed Distance below for strategies to help you determine an appropriate distance band for your analysis.
The Zone of Indifference conceptualization works well when fixed distance is appropriate, but imposing sharp boundaries on neighborhood relationships is not an accurate representation of your data. Keep in mind that, like the inverse distance methods, Zone of Indifference considers every feature a neighbor of every other feature. This option is not appropriate for large datasets since the Threshold Distance supplied does not limit the number of neighbors, but only specifies where the intensity of spatial relationships begins to wane.
The Polygon Contiguity conceptualization is effective when polygons are similar in size and distribution, and when spatial relationships are a function of polygon proximity. You will get very good performance, even for large datasets, when you use the Generate Spatial Weights Matrix tool to create a Spatial Weights Matrix file prior to analysis. In this case you would select the Get Weights From File option (instead of the Polygon Contiguity option) and would supply the pathname to the .swm file representing the polygon contiguity relationships for your data.
The K Nearest Neighbors option is effective when you want to ensure you have a minimum number of neighbors for your analysis. Especially when the values associated with your features are skewed (are not normally distributed), it is important that each feature is evaluated within the context of at least 8 or so neighbors (this is a rule of thumb only). When the distribution of your data varies across your study area so that some features are far away from all other features, this method works well. Note, however, that the spatial context of your analysis changes depending on variations in the sparsity/density of your features. When fixing the scale of analysis is less important than fixing the number of neighbors, the K Nearest Neighbors method is appropriate.
Some analysts consider Delaunay Triangulation a way to construct natural neighbors for a set of features. This method is a good option when your data includes island polygons (isolated polygons that do not share any boundaries with other polygons) or in cases where there is a very uneven spatial distribution of features. Similar to the K Nearest Neighbors method, Delaunay Triangulation ensures every feature has at least one neighbor, but uses the distribution of the data itself to determine how many neighbors each feature gets.
Constructing a spatial weights matrix file prior to analysis is always recommended, especially with large datasets or in cases where you will be running multiple analyses (analyzing more than one field in a dataset, and/or running both global and local versions of a statistic on a dataset).
Selecting a Fixed Distance
Think of the distance band you select as a moving window that momentarily settles on top of each feature and looks at that feature within the context of its neighbors. There are several guidelines to help you identify an appropriate distance band for analysis:
- Select a distance based on what you know about the geographic extent of the spatial processes promoting clustering for the phenomena you are studying. Often, you won't know this, but if you do, you should use your knowledge to select a distance value. Suppose, for example, you know that the average journey-to-work commute distance is 15 miles. Using 15 miles for the distance band is a good strategy for analyzing commuting data.
- Use a distance band that is large enough to ensure all features will have at LEAST one neighbor. Especially if the input data is skewed (does not create a nice bell curve when you plot the values as a histogram), you will want to make sure that your distance band is neither too small (most features have only one or two neighbors) nor too large (several features include all other features as neighbors), because that would make resultant Z scores less reliable. The Z scores are reliable (even with skewed data) as long as the distance band is large enough to ensure several neighbors (approximately 8) for each feature.
- Use a distance band that reflects maximum spatial autocorrelation. Whenever you see spatial clustering on the landscape you are seeing evidence of underlying spatial processes at work. The distance band that exhibits maximum clustering, as measured by the Spatial Autocorrelation (Global Moran's I) or Multi-Distance Spatial Cluster Analysis (Ripley's k-function) tools, is the distance where those spatial process are most "active" or most pronounced. Run the Spatial Autocorrelation tool at multiple distances (like 0.5, 1.0, 1.5, miles, etc.) and note where the resulting Z score seems to peak. Use the distance associated with the peak value for your analysis. Alternatively, run the Multi-Distance Spatial Cluster Analysis (Ripley's k-function) for a range of distances and identify where the difference between the observed and expected K value peaks (the DiffK field). Use the distance associated with the largest difference for your analysis. Note: distance values should be entered using the same units as specified by the Environment output coordinate system.
- Try not to get stuck on the idea that there is only ONE correct distance band. Reality is never that simple. Most likely there are multiple/interacting spatial processes promoting observed clustering. Rather than thinking you need one distance band, think of the pattern analysis tools as effective methods for exploring spatial relationships at multiple spatial scales. Consider that when you change the scale (change the distance band value) you may be asking a different question. Suppose you are looking at income data. With small distance bands you can examine neighborhood income patterns, middle scale distances might reflect community or city income patterns, and the largest distance bands would highlight broad regional income patterns.
Distance method
Many of the tools in the Spatial Statistics toolbox use distance in their calculations. These tools provide the user with the choice of either Euclidean or Manhattan distance.
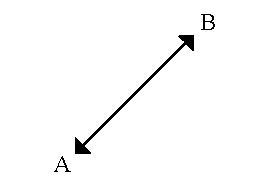
- Euclidean distance is calculated as:
D = sq root [(x1–x2)**2.0 + (y1–y2)**2.0]
Where (x1,y1) is the coordinate for point A, (x2,y2) is the coordinate for point B, and D is the straight-line distance between points A and B.
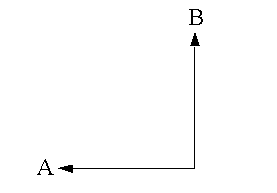
- Manhattan distance is calculated as:
D = abs(x1–x2) + abs(y1–y2)
Where (x1, y1) is the coordinate for point A, (x2, y2) is the coordinate for point B, and D is the vertical plus horizontal difference between points A and B. It is the distance you must travel if you are restricted to north/south and east/west travel only. This method is generally more appropriate than Euclidean distance when travel is restricted to a street network in cases where actual street network travel costs are not available.
Self-Potential (field giving intrazonal weight)
Several tools in the Spatial Statistics toolbox allow you to provide a field representing the weight to use for self-potential. Self-potential is the distance or weight between a feature and itself. Often this weight is zero, but in some cases you may want to specify another fixed value or a different value for every feature. If your conceptualization of spatial relationships is based on distances traveled within and among census tracts, for example, you may decide to model self-potential to reflect average intrazonal travel costs based on polygon size:
dii = 0.5*[(Ai / π)**0.5]
where dii is the travel cost associated with intrazonal travel for polygon featurei, and Ai is the area associated with polygon featurei.
Standardization
Row standardization is recommended whenever the distribution of your features is potentially biased due to sampling design or an imposed aggregation scheme. When row standardization is selected, each weight is divided by its row sum (the sum of the weights of all neighboring features). While row standardized weighting is often used with fixed distance neighborhoods or neighborhoods based on polygon contiguity in order to mitigate the unequal number of neighbors effect, you can also use it with distance-based neighborhoods. In a distance-based neighborhood that covers the entire study area, all features have an equal number of neighbors (that is, all other features are neighbors, unless a threshold distance is specified). For distance-based conceptualizations of spatial relationships row standardization will scale all weights so they are between 0 and 1, creating a relative, rather than absolute weighting scheme.
Distance Band or Threshold Distance
A distance band or threshold distance sets the scale of analysis for most conceptualizations of spatial relationships (e.g., Inverse Distance, Fixed Distance). It is a positive numeric value representing a cutoff distance. Features outside the specified cutoff for a target feature are ignored in the analysis for that feature. With Zone of Indifference, however, the influence of features outside the given distance is reduced in relation to proximity, while those inside the distance threshold are equally considered.
Choosing an appropriate distance is important. Some spatial statistics require each feature to have at least one neighbor for the analysis to be reliable. If the distance band/threshold distance is too small (so that some features have no neighbors), a warning message appears suggesting that you try again with a larger distance value. The Calculate Distance Band from Neighbor Count tool will evaluate minimum, average, and maximum distances for a specified number of neighbors and can help you determine an appropriate distance band value to use for analysis. See also Selecting a Fixed Distance for additional guidelines.
When no value is specified, a default threshold distance is computed. The table below indicates how different conceptualizations of spatial relationships behave for each of 3 possible input types (negative values are not valid):
|
|
Inverse Distance, Inverse Distance Squared | Fixed Distance, Zone of Indifference | Polygon Contiguity, Delaunay Triangulation, K Nearest Neighbors |
| 0 | No threshold or cutoff is applied; every feature is a neighbor of every other feature | Invalid. Runtime error will be generated. | Ignored. |
| blank | A default distance will be computed. This default will be the minimum distance to ensure that every feature has at least one neighbor. | A default distance will be computed. This default will be the minimum distance to ensure that every feature has at least one neighbor. | Ignored. |
| positive number | The non-zero, positive value specified will be used as a cutoff distance; neighbor relationships will only exist among features within this distance of each other | For Fixed Distance, only features within this specified cutoff of each other will be neighbors. For Zone of Indifference, features within this specified cutoff of each other will be neighbors; features outside the cutoff are neighbors too, but they are assigned a smaller and smaller weight/influence as distance increases. | Ignored. |
Number of Neighbors
Specify a positive integer to represent the number of neighbors to include in the analysis for each target feature. When the Conceptualization of Spatial Relationships is "K Nearest Neighbors", each target feature will be evaluated within the context of the closest "K" features (where "K" is the number of neighbors specified). For Inverse Distance or Fixed Distance, specifying a value for the Number of Neighbors parameter will ensure that each feature has a minimum of "K" neighbors. For Polygon Contiguity, the Number of Neighbors specified is only applied to island polygons: the "K" nearest polygons to each target island polygon will be considered neighbors for analysis.
Weights Matrix file
Several tools allow the user to define spatial relationships among features by providing a pathname to a spatial weights file. Spatial weights are numbers that reflect the distance, time, or other cost between each feature and every other feature in the dataset. The spatial weights matrix file may be created using the Generate Spatial Weights Matrix tool, the Generate Network Spatial Weights tool, or may be a simple ASCII file.
When the spatial weights matrix file is a simple ASCII text file, the first line should be the name of a Unique ID field. This gives you the flexibility to use any numeric field in your dataset as the id when generating this file, however, the ID field must have unique values for every feature. After the first line, the spatial weights file should be formatted into three columns:
- From feature ID
- To feature ID
- Weight
For example, suppose you have three gas stations. The field you are using as the ID field is called "StationID" and the feature IDs are 1, 2, 3. You want to model spatial relationships among these three gas stations using travel time in minutes. You could create an ASCII file that might look like the following:
StationID
1  1   0
1  2   1/10
1  3    1/7
2  1   1/10
2  3   1/20
3  1   1/6
3  2   1/15
3  3   0
Generally when weights represent distance or time, they are inverted (e.g., 1/10 when the distance is 10 miles or 10 minutes) so that nearer features have a higher weight than features that are farther away. Notice from the weights above that gas station 1 is 10 minutes from gas station 2. Notice also that travel time is not symmetrical in this example (traveling from gas station 1 to gas station 3 is 7 minutes, but traveling from gas station 3 to gas station 1 is only 6 minutes). Notice that the weight between gas station 1 and itself is zero, and that there is no entry for gas station 2 to itself. Missing entries are assumed to have a weight of zero.
Typing the values for the spatial weights matrix file can be a tedious job at best, even for small datasets. A better approach is to use the Generate Spatial Weights Matrix tool, or to write a quick python script to perform this task for you.
Spatial Weights Matrix File
The Generate Spatial Weights Matrix or Generate Network Spatial Weights tools will create a binary spatial weights matrix file (.swm) defining the spatial relationships among all of the features in your dataset based on the parameters you specify. If you are going to be running several analyses on a single dataset (e.g., identifying hot spots based on contiguity for several fields in the dataset or running several different spatial statistics on a single dataset), or if you have a dataset with more than 3000 features, it is recommended that you construct the spatial weights matrix file before running your analyses. Using the binary spatial weights matrix files created by these tools (.swm files) will greatly improve performance because they optimize the data in order to minimize calculations. If you edit a feature class (add, remove, or relocate features), you will need to recreate the spatial weights matrix file to ensure valid results.
If you have a table defining the spatial relationships among features in a feature class, use the Generate Spatial Weights Matrix tool to convert the table to a spatial weights matrix file (.swm). The table will need the following fields:
| Field Name | Description |
| <Unique ID Fieldname> | A field that exists in the input feature class with a unique ID for each feature. This is the "FROM" feature ID. |
| NID | A field containing neighbor feature IDs. This is the "TO" feature ID. |
| WEIGHT | This is the numeric weight quantifying the spatial relationship between the FROM and TO features. Larger values reflect bigger weights and stronger influence, or interaction, between two features. |
Sharing Spatial Weights Matrix Files
The output from the Generate Spatial Weights Matrix and Generate Network Spatial Weights tools is a .swm file. This file is tied to the input feature class, the Unique ID field, and to the output coordinate system settings when the .swm file was created. Other people can duplicate the spatial relationships you define for analysis by using both your .swm file and your input feature class. Especially if you plan to share your .swm files with others, try to avoid the situation where your output coordinate system differs from the spatial reference associated with your input feature class. A better strategy is to project the input feature class, then set the output coordinate system to "Same as Input Feature Class" prior to creating spatial weights matrix files.