Image and raster data management > Raster display and visualization
Improving the display of raster data |
|
|
Release 9.3
Last modified November 12, 2009 |


Print all topics in : "Raster display and visualization" |
About improving raster display
Note:
This topic was updated for 9.3.1.
ArcMap provides tools to enhance the display of a raster. This includes providing faster drawing methods and enhancements and retaining calculated raster dataset statistics.
For instance, you can change the brightness and contrast of your raster and display the raster transparently over other layers.
If your raster represents continuous data, you can apply a contrast stretch to it. A stretch increases the visual contrast of the raster. You might apply a stretch when your raster appears dark or has little contrast. Different stretches will produce different results in the raster display. You can experiment to find the best one for a particular raster.
Using faster drawing methods
You can reduce the time it takes to display a large raster dataset by creating pyramids. Pyramids record the original data in decreasing levels of resolution, created as a reduced resolution dataset (.rrd) file with the same file name as your raster dataset. ArcMap uses the appropriate level of resolution to quickly draw the entire dataset. You cannot build pyramids on a raster catalog; however, you can build them on each raster dataset within the raster catalog.
Learn more about raster pyramids.
Learn more about the reduced resolution dataset.
When you are working with raster catalogs, ArcMap can display your raster catalog as a wireframe (showing an outline of the dimensions for each raster dataset). To increase display efficiency, this occurs automatically if more than nine images are in the current extent. The default number of images can be manipulated on the Display tab of the raster catalog's Layer Properties dialog box.
Adjusting the brightness, contrast, and transparency
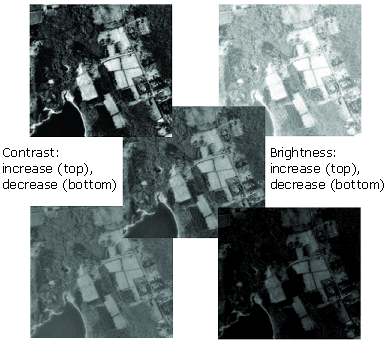
The Effects toolbar allows you to interactively adjust the brightness or contrast of a raster layer or make the raster layer display transparently. These enhancements are applied to the rendered screen display, not to the original raster dataset values. Brightness increases the overall lightness of the image—for example, making dark colors lighter and light colors whiter—while contrast adjusts the difference between the darkest and lightest colors. Below is an example of adjustments made to the brightness and contrast of an image.
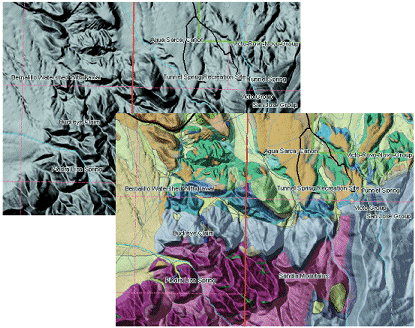
The Transparency tool allows you to see other data layers underneath the raster layer. Below, the top image does not use transparency; therefore, the hillshade obscures the underlying land-use layer. With transparency (bottom), the underlying symbology appears through the hillshade, yielding a three-dimensional effect.
Applying contrast stretches
If your raster data represents continuous data, you can apply a contrast stretch to it based on the statistics of the raster dataset. A stretch increases the visual contrast of the raster display. You might apply a stretch when your raster display appears dark or has little contrast. For example, images may not contain the entire range of values your computer can display; therefore, you could stretch the image's values to utilize this range by applying a contrast stretch. This may result in a crisper image, and some features may become easier to distinguish.
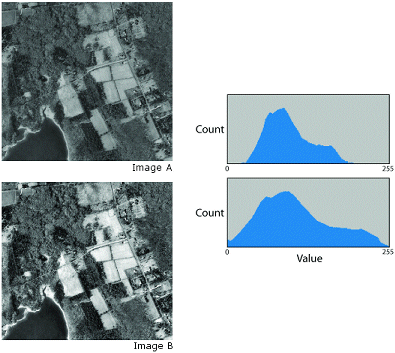
Below is an example of a contrast stretch. Histogram A represents the pixel values in image A. By stretching the values (shown in histogram B) across the entire range, you can alter and visually enhance the appearance of the image (image B).
Different stretches will produce different results in the raster display. You can experiment to find the best stretch for a particular raster dataset.
The types of stretches in ArcMap include a custom manual option or several standard methods. These standard stretches can be used with either the RGB Composite or Stretched renderer. The standard stretches are Standard Deviations, Minimum-Maximum, Histogram Equalize, and Histogram Specification. You might use the Minimum-Maximum stretch to spread out tightly grouped values. The Histogram Equalize and Histogram Specification stretches obtain their values from your histogram manipulation. A two-standard deviation stretch is the default setting for raster datasets that have statistics, and it is used to brighten raster datasets that normally appear dark.
With any of these stretch methods, you can examine and modify a histogram and see basic statistics (such as minimum, maximum, mean, and standard deviation) about your data. You could utilize these statistics to emphasize a particular value or to examine distribution. When you adjust the histogram, you see multiple sets of vertical bars: the purple bars represent the current display values, and the gray bars represent your original values. When using multiband data in the RGB Composite renderer, the red, green, and blue bars represent the current display values.
You can also apply a gamma stretch to your raster data if you are stretching your data with the following contrast stretches: None, Standard Deviation, or Minimum-Maximum. When preparing raster data for computer display, the gamma refers to the degree of contrast between the midlevel gray values of a raster dataset. Gamma does not affect the black or white values in a raster dataset, only the middle values. By applying a gamma correction, you can control the overall brightness of a raster dataset. If the gamma coefficient is set too low, middle tones appear too dark; however, if the gamma coefficient is set too high, middle tones appear too light and the raster dataset looks bleached out. Gamma changes not only the brightness but also the ratios of red to green to blue.
In the example below, you can see the effect of adjusting the gamma values used to display a raster dataset. Each of these values was added to the red, green, and blue bands. By applying different values to each band, you could adjust the degree of red, green, and blue.

If you have stretched the entire histogram of your raster dataset and it still isn't displaying with enough contrast, you can try creating a stretch based on the pixels within the display's extent. To do this, gather statistics using the From The Current Display Extent option on the raster dataset Properties dialog box on the Symbology tab for either the Stretched or RGB Composite renderer. This option allows only the statistics from the pixels within the display, rather than the entire raster dataset, to be used to calculate the contrast stretch. Since a smaller number of cell values exist in the display extent, a smaller range of cell values will most likely be used; this allows a greater contrast stretch. Each time the display extent (or location) changes, the raster dataset could display differently because the contrast stretch calculated for the cell values in the display could change. If you want to apply a specific set of statistics to a certain extent, you can do this through the Custom Statistics option.
Learn how to work with the histogram.
Changing the display of the background
Backgrounds and outlines can often be the result of georeferencing your raster dataset. If your raster data has a background, border, or other NoData values, you can choose not to display them or choose to display them as a particular color.
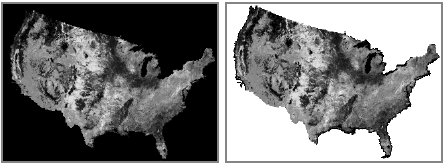
The images below show a NoData area with a black background and that same area using No Color.
Learn more about removing the background area when displaying a raster layer.
Learn more about NoData in raster datasets.
Working with auxiliary files and raster proxies
When a raster dataset is used in ArcGIS and auxiliary information (such as statistics, histograms, and pyramids) cannot be found inside the raster dataset or in an associated auxiliary file, ArcGIS will build and store it. ArcMap only has to build this information once and automatically reads it each time you display the raster dataset. Normally, auxiliary data is stored inside the raster dataset itself if the format allows it, or it can be written to auxiliary files next to the raster dataset.
If a raster dataset is marked with read-only permissions or is in a read-only folder, then auxiliary files or raster proxy files are subsequently written to a different writable location such as a temporary directory in a folder named raster proxy files.
Learn about raster statistics.
Learn more about auxiliary files.
Learn more about proxy files.
How to improve raster display
Improving the brightness or contrast of your raster layer
- Click the View menu, point to Toolbars, then click Effects.
- Click the Layer drop-down arrow and choose the raster layer for which you want to change the brightness or contrast.
- Click the Brightness button
 or the Contrast button
  .
.
- Drag the slider to increase or decrease the brightness or contrast.
| Tip |
|
Drawing a raster layer transparently
- Click the View menu, point to Toolbars, then click Effects.
- Click the drop-down arrow and click the raster layer you want to draw transparently.
- Click the Adjust Transparency button
 .
.
- Drag the slider to adjust the transparency.
Stretching a raster to improve the visual contrast
- In the table of contents, right-click the raster layer for which you want to increase the visual contrast and click Properties.
- Click the Symbology tab.
- Click Stretched.
- If your raster dataset has multiple bands, choose the band you want to stretch.
- Optionally, click the Label text boxes and type labels for the table of contents.
- Click the Color Ramp drop-down arrow and click a color ramp.
- Optionally, choose a color or No Color to display any NoData values.
- Optionally, click the Stretch Type drop-down arrow and click the type of stretch you want to perform.
- Click OK.
| Tip |
|
Enhancing the visual contrast based on the values in the display extent
- In ArcMap, zoom in to an area of your raster dataset where you want to enhance the visual contrast.
- In the table of contents, right-click the raster layer and click Properties.
- Click the Symbology tab.
- Click either the Stretched or RGB Composite renderer.
- Click the Statistics drop-down arrow and click From The Current Display Extent.
- Click OK.
Saving the display extent statistics
- Make the enhancement changes using steps 1–6 from Enhancing the visual contrast based on the values in the display extent (above).
- Click Apply to see if the display is satisfactory.
- Click Save as XML.
- Navigate to where you want to save the XML file and click Save.
- Click OK.
Loading custom statistics
- In the table of contents, right-click the raster layer and click Properties.
- Click the Symbology tab.
- Click either the Stretched or RGB Composite renderer.
- Click the Statistics drop-down arrow and click From Custom Settings.
- If the statistics are located in a raster dataset, click Import.
If the statistics are located in an XML file, click Load XML. - Navigate to the statistics file and click either Add or Open.
- Click OK to render the raster dataset with the loaded statistics.
Changing the default setting for building pyramids
- Click Tools on the Main menu and click Options.
- Click the Raster tab.
- Click the General tab.
- Click the choice that describes when you want to create pyramid layers such as Always build pyramids and don't prompt in the future.
- Click OK.
Importing Layer Symbology
- In the table of contents, right-click the raster layer and click Properties.
- Click the Symbology tab.
- Click Import.
- Choose a raster layer file to import either from the drop-down list or by navigating to the raster layer file.
- Click OK on the Import Symbology dialog box.
- Click OK on the Layer Properties dialog box.
| Tips |
|