Extensions > Military Overlay Editor > Using MOLE with 2D maps
Editing MOLE graphics from within ArcMap |
|
|
Release 9.3
Last modified December 4, 2009 |


Print all topics in : "Using MOLE with 2D maps" |
About editing MOLE graphics from within ArcMap
There are several ways to make changes to MOLE graphics (force elements and tactical graphics). Which method you choose depends mainly on where you want to save your changes (map or data). Tell me more about the different methods.
Another consideration is whether you want to apply the changes to a single layer, multiple layers, or selected graphics.
The topics below describe the ways you can edit MOLE graphics. For example, you can change their appearance or size.
For information on saving edits to your data, see Starting and stopping an edit session. For information on saving edits to your map, see Saving a map and exiting ArcMap. If you are working in a multi-user database, see Refresh one or more MOLE layers.
-
Select and identify graphics
-
Edit a graphic (or change it from one military symbol to another)
-
Edit a graphic using the MOLE toolbar
-
Control text size
-
Create a favorites list
-
Add a graphic to your favorites list
-
Change the graphic size of force elements for a layer
-
Apply boundary and fill settings to a layer
-
Use styles with force elements
-
Use styles with tactical graphics
-
Edit multiple MOLE graphics at once
For tutorial exercise on editing MOLE graphics from within ArcMap, see Exercises 2 and 3 in Chapter 5 of the Installing and Getting Started with Defense Solutions guide.
For information on editing 3D MOLE graphics within ArcGlobe, see Using MOLE with 3D maps, and within that topic, the sections on billboarding, extruding, and draping MOLE graphics.
How to edit MOLE graphics from within ArcMap
Select a MOLE graphic
As described in the following procedures, you can:
-
Select one or more graphics in a layer by clicking in the map display
-
Select all graphics in a layer
-
Select graphics in multiple layers
-
Select hand-picked graphics across layers
-
Select all graphics in a data frame
To select one or more graphics in a layer by clicking in the map display
You typically select a single MOLE graphic so that you can open the MOLE Symbol Editor and apply edits to it (change it from one military symbol to another or change its attribute data/labels or other characteristics) or to apply a single leader to it.
You typically select more than one MOLE graphic so that you can:
- Change their leader ability or stack ability at one time.
- Make edits to their attribute data all at one time using the ArcMap Attributes tool. For more information, see Edit multiple MOLE graphics at once.
-
Start ArcMap.
- Make sure you have added the MOLE layer that contains the graphic(s) you want to select.
- To ensure you select graphics only in a layer, highlight the MOLE graphic layer in the table of contents that contains the graphics you want to select. (For most actions you can take on selected graphics, you can highlight the group layer instead.)
- If you plan to make edits to the graphic(s) you select, start an ArcMap editing session; then, on the ArcMap Editor toolbar:
- Click the Target drop-down menu to select the layer that corresponds to the MOLE layer you wish to edit.
- Click the Task drop-down menu to select the Modify Feature task.
- Click the Select Graphics button
 on the MOLE toolbar.
- In the map display, click a MOLE force element or tactical graphic you want to select (or edit).
- Hold down the Ctrl key and click the graphics you wish to select, one at a time.
- Click and drag a box around the graphics you wish to select. MOLE selects any graphic that is intersecting the box border or is contained within the defined box.
You can also select multiple layers in this step by pressing and holding the Ctrl key while highlighting MOLE layers in the table of contents.
You can select more than one graphic using one of two methods:
or
You are ready to edit the graphics you’ve selected.
If you've selected only one graphic, you can click the MOLE Symbol Editor button
For more information on editing MOLE graphics, see Edit a graphic (or change it from one military symbol to another) or Edit a graphic using the MOLE toolbar.
The MOLE Select Graphics button performs the same function as the ArcMap Select Features tool, except that it operates exclusively on MOLE graphics. It allows you to select MOLE graphics (symbols) without having the features sublayer of the MOLE group layer displayed.
NOTE: You must start an edit session to enable the MOLE Symbol Editor button on the MOLE toolbar.
To select all graphics in a layer
You select all MOLE graphics in a layer so that you can perform such tasks as:
- Using the Layer Properties dialog box to make the same changes to all the graphics in the layer at one time.
- Using items on the MOLE toolbar to make the same change to all the graphics in the layer at one time.
-
Start ArcMap and add at least one MOLE layer.
- If you plan to make changes to the graphics in the layer after you select them, start an ArcMap editing session; then, on the Editor toolbar:
- Click the Target drop-down menu to select the layer name that corresponds to the MOLE layer you want to edit.
- Click the Task drop-down menu and select Modify Feature.
- In the ArcMap table of contents, click to highlight the MOLE graphic layer (sublayer) of the MOLE group layer whose graphics you want to select. Make sure the check box for the MOLE group layer is checked.
- Either use the MOLE toolbar items to make changes to the graphics or double-click the MOLE graphics layer to open the MOLE Layer Properties dialog box to make changes to the graphics.
The graphics in the layer you highlighted are selected.
You can select more than one layer by pressing and holding the Ctrl key as you click MOLE graphic layers in the table of contents.
To select graphics in multiple layers (to select multiple layers)
-
Start ArcMap and add at least one MOLE layer.
- Press and hold the Ctrl key while clicking on the layers you want to select in the table of contents. When you click, click on the MOLE graphic layer portion of the MOLE group layer.
The MOLE graphics in each layer you selected are selected. You can now make changes to them, such as resizing them using the Graphic Height button
To select hand-picked graphics across layers
- Click on white space in the table of contents to deselect all layers.
- On the MOLE toolbar, click the Select Graphics button .
- Press and hold the Ctrl or Shift key.
- In the map display, click the MOLE graphics you want to select.
Or, you can limit your selectable layers by highlighting in the table of contents only the MOLE graphic layers you want to be able to select MOLE graphics in. To highlight more than one layer, press and hold the Ctrl key as you highlight the layers you want to include.
To select all graphics in a data frame
Several MOLE toolbar buttons, such as the Graphic Height
Another way to select all graphics in a data frame is to select nothing in the data frame's table of contents, because all layers is the default selection behavior for MOLE toolbar buttons when no layers are selected. So you can have MOLE apply any of its toolbar functions to all MOLE graphics in the data frame by clicking white space in the table of contents below the layers, then using the toolbar.
To get the same global selection effect, you can press and hold the Ctrl button while clicking each MOLE layer in the table of contents.
| Tip |
|
Identify MOLE graphics
- If you haven't already, add at least one MOLE layer in ArcMap.
- In the map display area, click the MOLE graphic you want to identify.
- The Identify Results dialog box appears, listing the attributes and attribute values of the MOLE graphic you selected.
- Press and hold the Ctrl key while clicking the graphics in the map display you wish to select, one at a time.
- Click and drag a box around the graphics you wish to select. MOLE selects any graphic that is touching the box.
On the MOLE toolbar, click the Identify Graphics button.
You can have identify results display in the Identify Results dialog box for more than one graphic after clicking the Identify tool using one of the following methods:
| Tip |
Edit a graphic (or change it from one military symbol to another)
Two methods you can use to edit graphics are:
- You can use the MOLE Symbol Editor to make changes to a force element or tactical graphic, change it from one military symbol to another military symbol, or edit its attributes/labels (also known as text). You can preview the changes as you make them, with the exception of the label changes.
- You can also make these changes manually by editing the attribute table that's associated with the force element or tactical graphic. Editing the attribute table also allows you to edit attributes/labels (text).
Use the MOLE Symbol Editor to change a force element or tactical graphic
- If you haven't already, add at least one MOLE layer and start an ArcMap edit session.
- On the Editor toolbar:
- Click the Target drop-down menu to select the layer that corresponds to the MOLE layer you want to edit.
- Click the Task drop-down menu and select Modify Feature.
- On the MOLE toolbar, click the Select Graphics button .
- In the map display, click the MOLE graphic you want to edit.
- Click the MOLE Symbol Editor button.
- Change the settings in the MOLE Symbol Editor to edit the symbol. You can change the properties of the symbol that are associated with the Symbol ID code as well as attribute data (also known as labels or text modifiers). You can change the properties of the symbol that are associated with the Symbol ID code by using the tree view in the left pane, the Modifiers area, and the Message String/Symbol ID area. For tips on using the MOLE Symbol Editor, see The MOLE Symbol Editor. For more information on the Attribute area of the MOLE Symbol Editor, see Attribute data field descriptions.
- Click OK to apply your changes and close the MOLE Symbol Editor.
- You may need to modify the shape of the feature so it conforms to the geometry requirements of the military specification you chose. If the feature's geometry does not satisfy the military specification geometry requirements, MOLE displays the message "Unable to Render Selected Feature in the MOLE Symbol Editor" and displays the graphic as a simple magenta feature in the map display.
- For more information on the geometry requirements that tactical graphics must adhere to for MOLE to display the graphics properly, see Symbology rendering in MOLE. For the procedure for editing tactical graphics once they are on the map, see Using the Add MOLE Graphic tool to create tactical graphics from within ArcMap
. For a sample tactical graphic add and edit procedure, see Creating three-line air corridors.
- For information on saving edits to your data, see Starting and stopping an edit session. For information on saving edits to your map, see Saving a map and exiting ArcMap.
- You can copy the graphic in the preview area of the MOLE Symbol Editor and paste it into another application, such as Microsoft Office Word. To copy the preview image, right-click in the preview area and click Copy to Clipboard.
- For additional ways to change/edit MOLE graphics, see Change the graphic size of force elements, Use styles with force elements, Use styles with tactical graphics, and Apply boundary and fill settings to a layer.
In some cases you may also have to highlight the MOLE tactical graphic or force element graphics layer in the ArcMap table of contents.
The MOLE Symbol Editor button
The MOLE Symbol Editor appears.
MOLE applies your edits to the symbol.
If the symbol is a tactical graphic:
You can also use standard ArcMap editing functions to edit the feature layer of a MOLE group layer, but these functions will not give you access to the Symbol ID code editing features of the MOLE Symbol Editor.
Tips:
Edit a force element or tactical graphic by editing its attribute table
- If you haven't already, add at least one MOLE layer and start an ArcMap edit session.
- If you know which MOLE layer the graphic is in, right-click the feature sublayer of the MOLE group layer, then click Open Attribute Table. Otherwise, see How can I identify which layer a feature or graphic belongs to?
- In the Attributes window, click a field whose value you want to change, then type a new value for it. You can edit labels (modifiers), such as Name and DTG, or you can edit the Symbol ID code of a feature/graphic by editing its Symbol_ID column.
- When you are finished editing fields, click the X in the upper right corner of the Attributes window to apply your edits.
The Attributes window appears, displaying all the attributes for the MOLE layer you selected. Each feature (MOLE graphic) corresponds to one row in the table.
The next time you save your edit session edits, the edits you made are saved to your data.
For information on where changes get saved under what circumstances, see Ways you can edit MOLE graphics.
For information on editing one or more attributes across multiple MOLE graphics at one time, see Edit multiple MOLE graphics at once.
| Tips |
|
Edit a graphic using the MOLE toolbar
You can use the MOLE toolbar to:
-
Change the size (graphic height) of a MOLE graphic(s) in ArcMap and ArcGlobe. This procedure also changes text height for force elements and height for some text for tactical graphics.
-
Change the text height of tactical graphics in ArcMap and ArcGlobe.
-
Edit a tactical graphic as you create it in ArcMap.
Using the MOLE toolbar to make these edits lets you bypass the Layer Properties dialog box, which means you can apply edits to more than one layer at a time—whichever layers are selected in the table of contents. Or you can apply the edits to all layers in the table of contents by clicking white space in the table of contents to deselect all layers.
To change the size of a graphic(s) using the MOLE toolbar
Changing the size of all force elements at once is especially useful when the coordinate system of the force element layers in your map is different from the coordinate system of other layers in the data frame.
For example, if you add a MOLE force element layer defined with a geographic coordinate system to an ArcMap map (data frame) with a Universal Transverse Mercator (UTM) projection, the force element graphics may not appear in the map display area. This is likely because the size units of the force element graphics were set to decimal degrees, while the units of the UTM map are meters. The graphics are there, but they are too small to be seen. You can quickly remedy this by using the toolbar to adjust graphic height.
-
Add a MOLE layer to your map in ArcMap (or ArcGlobe if you want to use 3D maps).
- Either select a layer(s) whose graphics' size you want to change or select one or more graphics in one layer or across multiple layers whose size you want to change. For information on the selection methods, see Select a MOLE graphic.
- On the MOLE toolbar, click the Graphic Height button
 . You might have to click the additional tools drop-down menu on the MOLE toolbar to make this button available.
- In the map display area:
- To set the new graphic height in map units, left-click and drag to draw a box.
- To set the new graphic height as a percentage of the current extent (also known as Screen), right-click and drag a box.
-
If you chose map units (left-clicked and dragged the box), the box you drew represents the number of map units MOLE should make the new graphic height. Map units are the units of measure for the layer, established by the layer's coordinate system. Using map units, symbol size is relative to the zoom. When you zoom out, the graphics shrink in size; when you zoom in, they increase in size.
-
If you chose a percentage of the current extent (right-clicked and dragged the box), the box you drew represents a percentage of the current extent in the map display. Using this percentage, symbol size remains constant. When you zoom out or in, graphics stay the same size you originally specified.
- To disable the Graphic Height tool, click any other toolbar button.
-
Set echelon scaling
-
Enable leadering
-
Enable stacking
-
Apply the distance-tolerance leadering rule to leader force elements
-
Apply the distance-tolerance stacking rule to stack force elements
-
Set leader ability
-
Set stack ability
-
Apply a single leader
For general information about data frames, see Working with data frames.
MOLE immediately applies the new size; however, you won't notice a difference between the two options until you zoom in or out, as explained in the following text. View illustration of sample result.
MOLE will use the height of the box you drew (for more information, see More about how friendly frame height is determined and used) as the new height for the graphics in the layers you selected and will resize the graphics accordingly:
Sizing set in echelon scaling rules will override changes you make using this procedure. For details, see Having graphics in the echelon range resize when the zoom is within the zoom range.
You can also change the size of force elements using the Layer Properties dialog box; see Change the graphic size of force elements for a layer. Using the Layer Properties dialog box restricts you to resizing graphics for one layer at a time but lets you specify a precise value instead of using the height of a box you draw.
For more information on coordinate systems, see About geographic coordinate systems and About projected coordinate systems.
You can also use the MOLE toolbar to:
For information on where changes get saved under what circumstances, see Ways you can edit MOLE graphics.
To change the text height of tactical graphics using the MOLE toolbar
-
Add a MOLE layer to your map in ArcMap (or ArcGlobe).
- In the ArcMap (or ArcGlobe) table of contents, select the tactical graphic layer or layers whose text you want to change the size of.
- On the MOLE toolbar, click the Text Height button
 . You may have to first click the drop-down arrow next to the Refresh Graphics button
  to expose the Text Height button. See The MOLE toolbar for more information.
- In the ArcMap or ArcGlobe map display area, click and drag a box to set the text height.
- Click any other toolbar button to disable the Text Height tool.
You can also use the MOLE toolbar to: -
Set echelon scaling
-
Enable leadering
-
Enable stacking
-
Apply the distance-tolerance leadering rule to leader force elements
-
Apply the distance-tolerance stacking rule to stack force elements
-
Set leader ability
-
Set stack ability
-
Apply a single leader
You can select all MOLE layers in the table of contents by highlighting the highest level in the table of contents, the data frame level. By default, the data frame is named Layers. For information on MOLE layers in a data frame, see MOLE data: an introduction. For general information about data frames, see Working with data frames.
You can highlight more than one layer by holding down the Ctrl key while you click the layers in the table of contents.
MOLE uses the height of the rectangle you drew as the new height for the text for the layers you selected (or all graphics on the map if you selected the data frame in step 2) and resizes the text accordingly.
For information on where changes get saved under what circumstances, see Ways you can edit MOLE graphics.
To edit a tactical graphic you are creating
You can edit a tactical graphic as you create it with the Add MOLE Graphic tool. This tool is accessible from the MOLE drop-down menu on the MOLE toolbar. Details for making edits using this tool are provided in Using the Add MOLE Graphic tool to create tactical graphics from within ArcMap.
| Tip |
Control text size
Force elements
The size of the text next to force elements is proportional to the height of the graphic, so one way to change the size of the text for a force element is to change the size of the graphic it is next to. To change the size of the graphic, you can do either of the following:- Use the Graphic Height button on the MOLE toolbar ; see To change the size of a graphic(s) using the MOLE toolbar in Edit a graphic using the MOLE toolbar. (See More about how friendly frame height is determined and used for specific information about the functioning of the Graphic Height button.)
- Use the Layer Properties dialog box; see Change the graphic size of force elements for a layer.
You can also change the size of the text without changing the size of the graphic, by creating a new style for the layer; see Use styles with force elements.
Tactical graphics
Controlling text size for tactical graphics is somewhat different. Some of the text for tactical graphics is an integral part of the graphic itself:- The size of this text can only be changed by changing the size of the graphic. To change the size of the graphic, do one of the following:
- Use the Graphic Height button on the MOLE toolbar, . (See More about how friendly frame height is determined and used for specific information about the functioning of the Graphic Height button.)
- Use the Layer Properties dialog box, Renderers tab, Symbol Height input field. (The symbol height you specify will apply to all the renderers in the right-hand list--the Associated Renderers list.)
- Text that is an integral part of a graphic cannot be edited.
The size of some of the text for tactical graphics can be changed, however, and this text can also be edited. To change the text size, you can do any of the following:
- Use the Text Height button on the MOLE toolbar,
 . For more information, see To change the text height of tactical graphics using the MOLE toolbar in Edit a graphic using the MOLE toolbar.
- Use the Layer Properties dialog box, Renderers tab, Text Height input field. (The text height you specify will apply to all the renderers in the right-hand list--that is, the Associated Renderers list.)
- Create a style for the layer with a larger text font; see Use styles with tactical graphics.
For more information about editing this text, see Edit a graphic (or change it from one military symbol to another).
Create a favorites list
You can add military symbols to a favorites list so that they are always handy and easy to use.
The favorites list is created the first time you specify that you want to add a military symbol to it. You work with the list in the MOLE Symbol Editor (so you must have started an ArcMap edit session to access the list).
- If you haven't already, start ArcMap, add at least one MOLE layer and start an ArcMap edit session.
-
Select a MOLE graphic. Make sure the target layer it belongs to is selected in the Target drop-down list on the Editor toolbar. If you select the symbol you want to add to favorites in this step, you can skip step 4.
- Click the MOLE Symbol Editor button
 on the MOLE toolbar.
- In the Symbol Library tree area of the MOLE Symbol Editor, navigate to the symbol you want to add to your favorites list and click to select it. For tips on navigating to symbols in the MOLE Symbol Editor, see The MOLE Symbol Editor.
- Right-click the selected symbol and select Add to Favorites.
MOLE adds the graphic you selected to your favorites list. The favorites list appears as a high-level branch in the Symbol Library tree.
If this is the first symbol you've chosen to add to your favorites, MOLE creates the favorites branch.
Add a graphic to your favorites list
- If you haven't already, start ArcMap, add the MOLE toolbar, add at least one MOLE layer and start an ArcMap edit session.
-
Select a MOLE graphic. Make sure the target layer it belongs to is selected in the Target drop-down list on the Editor toolbar. If you select the symbol you want to add to favorites in this step, you can skip step 4.
- Click the MOLE Symbol Editor button on the MOLE toolbar.
- In the Symbol Library tree area of the MOLE Symbol Editor, navigate to the symbol you want to add to your favorites list and click to select it. For tips on navigating to symbols in the MOLE Symbol Editor, see The MOLE Symbol Editor.
- Right-click the selected symbol and select Add to Favorites.
MOLE adds the graphic you selected to your favorites list. The favorites list appears as a high-level branch in the Symbol Library tree.
Also see Create a favorites list.
Change the graphic size of force elements for a layer
You can resize force elements in a feature-based layer using the procedure below. The procedure also applies to ArcGlobe.
To change the size of force elements in more than one layer at a time, see To change the size of a graphic(s) using the MOLE toolbar in Edit a graphic using the MOLE toolbar.
-
Add at least one MOLE force element layer to a map in ArcMap (or ArcGlobe).
- In the ArcMap (or ArcGlobe) table of contents, double-click the graphics layer of a MOLE force element group layer.
- Click the Symbols tab.
- In the Size area, select Map or Screen to indicate the method you want to use to change graphic height:
- Click Map to indicate that you want the units of the value in the adjacent text box to be map units, which are the units of measure for the layer, established by the layer's coordinate system. For example, if the coordinate system is WGS_1984 and Map is selected, then a value of 1 in the adjacent text box will make the force elements 1 degree of latitude in height.
- Click Screen to set the height of the force elements to a percentage of the current extent in the map display. For example, if the current extent is 10 degrees latitude in height and Screen is selected, then a value of 0.1 in the adjacent text box will give the force elements a height of 1 degree of latitude, or 10 percent of 10.
- Click OK.
The MOLE Layer Properties dialog box for force elements appears.
If you select Map, when you zoom out, the force elements shrink in size; when you zoom in, they increase in size.
If you select Screen, symbol size remains constant, regardless of zoom. When you zoom in or out, graphics stay the same size you originally specified.
As part of the resizing, MOLE also uses L and friendly frame height. For more information, see More about how friendly frame height is determined and used.
MOLE resizes the graphics to the height you specified.
- You can also change the size of force elements using the Layer Properties dialog box when you set echelon scaling. The size you set for echelon scaling overrides the size you set using the above procedure. For more information, see Having graphics in the echelon range resize when the zoom is within the zoom range.
- For more information on coordinate systems, see About geographic coordinate systems or About projected coordinate systems.
- You can control the size of text. For more information, see Control text size in How to edit MOLE graphics from within ArcMap.
Apply boundary and fill settings to a layer
The following common boundary and fill combinations have been pre-defined in MOLE for your use (click to view an illustration):
-
Draw boundary and fill (default)
Draw boundary only (transparent fill)
No boundary or fill
Use white lines (for dark maps)
You can apply one of these pre-defined options to a MOLE force element layer in ArcMap or ArcGlobe. You can apply the option to the layer at any time you want, or you can apply it as part of a style you create.
Also known as styles, these options differ from MOLE styles because they can be applied to a layer outside of a style and they can be applied by a single click in the Options drop-down (versus the multiple clicks needed to create a style).
-
Add at least one MOLE force element layer to a map in ArcMap (or ArcGlobe).
- In the ArcMap (or ArcGlobe) table of contents, double-click the graphics layer of a MOLE force element group layer.
- Click the Symbols tab.
- In the Style area, click the Option drop-down list and select the boundary and fill combination you want to apply to the layer.
- Click OK to apply the new boundary and fill combination to the layer.
The MOLE Layer properties dialog box for force elements appears.
The preview window shows an example of what the change will look like.
The map display reflects the new boundary and fill combination.
The next time you save the map, the edits will be saved in the layer of the map. To save the setting, save the .mxd or .3dd file by clicking the Save button
For information on applying one of these pre-defined options to a style you create, see Use styles with force elements.
Use styles with force elements
MOLE styles for force elements let you:
- Customize the way force elements in a layer display.
- Store the customizations for later use and reuse.
A MOLE style is a collection of graphic components; each graphic component has settings you specify. When you create or edit a style, you specify settings for its components, one at a time.
You can also apply a pre-defined boundary and fill combination to a style (see Apply boundary and fill settings to a layer). This combination will override any graphic component settings you specified that it conflicts with.
Because graphic components are pieces of military symbology, such as frame borders and fill colors, when you edit them, you are likely departing from the military symbol specification you chose for the layer. But this can be helpful. Tell me how.
MOLE styles differ from ArcGIS styles. MOLE styles can be saved only as part of a MOLE layer, through that layer's saved information in an .mxd, .3dd, or .lyr file. Because styles are created and stored in layers, if you want to use a style in layer A that you created in layer B, you must re-create the style in layer A.
The topics below describe how to do the following in ArcMap and ArcGlobe:
Also see Use styles with tactical graphics.
Creating a style
- In the ArcMap (or ArcGlobe) table of contents, double-click the graphics layer of a MOLE force element group layer to which you want to add a style. Tell me how to add a MOLE layer.
- Click the Symbols tab.
- In the Style section, in the New Name text box, type a name for the new style you want to create.
- In the Name drop-down menu, select a style that is most like the new style you want to create. Every style you create is copied from an existing style. If this is the first style you are creating, there will be only one style listed here, Default. The default style is a style that strictly adheres to the specification you chose for this layer.
- Click the Add button. If the Add button didn't become available when you typed a style name, it is because the name you typed matches an existing style in this layer. You must type a name unique to this layer. Note the New Name field is not case-sensitive, so it considers My_Style and my_style to be the same name.
The MOLE force element Layer Properties dialog box appears.

The Name drop-down menu displays the name you just typed, indicating the new style has been created and is set as the current style for this layer.
Now you are ready to specify settings for the graphic components of the new style by editing the style you just created. Skip to step 4 of Editing a style.
Editing a style
When you edit a style, you either:
- Edit the graphic components in it that you want to change, one at a time.
- Select a pre-defined boundary and fill combination for the style.
or do both of the above.
You typically wouldn't use only the second option above, because you can apply a pre-defined combination outside of styles more quickly (a layer can have only one combination applied to it at a time).
To edit a style
- In the ArcMap (or ArcGlobe) table of contents, double-click the graphics layer of a MOLE force element group layer that contains the style you want to edit. Because styles are saved with the map, not with the data, you can edit styles at any time as long as you've opened the .mxd, .3dd, or .lyr file containing the style you want to edit. Tell me how to open a map. Tell me how to add a MOLE layer.
- Click the Symbols tab.
- In the Style area, in the Name drop-down menu, select the name of the style you want to edit. If only one style, Default, is listed, you haven't created any styles yet. Default is a style that strictly adheres to the specification you chose for this layer. It is always available.
- Edit the style's graphic components you want to change, one at a time:
- Click the Component drop-down arrow to select the graphic component whose properties you want to change for the style. Several of these list items actually represent groups of graphic components. For example, Friendly Present Frame Fill contains settings for several graphic components, including fill color, frame color, and frame thickness.
- In the properties dialog box, change settings to reflect how you want to change the graphic component's appearance for this style.
- In the Properties area, click the Type dropdown arrow and select Gradient Fill Symbol.
- On the Gradient Fill tab that displays, in the Color Ramp area, click the Style dropdown arrow to select the green gradient you want.
- Click OK to close the properties dialog box.
- Select the next graphic component you want to edit from the Component drop-down menu, then repeat this step (step 4). Repeat this step for as many graphic components you want to change for this style. When finished, continue to step 5.
- When you are finished editing components, view the preview window of the Symbols tab. The graphic(s) in the preview window that correspond to the affiliation/status of the component(s) you edited will reflect the changes you made to components.
- You can apply a pre-defined boundary and fill combination to the layer by selecting one from the Option drop-down menu. The combination you select will override any graphic component settings you specified that it conflicts with. For illustrations of each combination, click a link below:
- If you want to use fonts instead of graphics for text in MOLE labels, check Use Text Fonts. Graphic text is built by using polygon shapes for each letter of a word; the polygon shapes come from the MOLE AlphaPolygons feature class in the MoleCore database. It is vector-based text.
- Edit the Text Symbol component if you are using fonts for text in MOLE labels, that is, if the Use Text Fonts check box is checked. The Text Symbol component is associated with font-based text. So if Use Text Fonts is not checked, MOLE will not use the Text Symbol component, nor your edits to it.
- Edit the Text Fill component if you are using graphics for text in MOLE labels, that is, if the Use Text Fonts check box is not checked. The Text Fill component is associated with graphic-based text. So if Use Text Fonts is checked, MOLE will not use the Text Fill component, nor your edits to it.
- On the Layer Properties dialog box, click OK.
The MOLE force element Layer Properties dialog box appears.
View graphic components list and example.
For example, if you want all force elements in the layer that have a friendly affiliation (that have an F in the second character of the Symbol_ID field) to have a gradient green fill, you would click Friendly Present Frame Fill in the Component drop-down menu as the first step.
The properties dialog box for the graphic component you selected appears. If it doesn't, click the Edit button
For example, to change the fill color of friendly force elements (the Friendly Present Frame Fill item) to a green gradient:
The Preview area shows how the changes you made will appear.
Note that using graphic components (selecting no color in a frame fill component) is one way to use transparency with MOLE. Others include applying a pre-defined boundary and fill combination (discussed in the next step), interactively revealing layers, and adjusting layer transparency.
-
Draw boundary and fill (default)
Draw boundary only (transparent fill)
No boundary or fill
Use white lines (for dark maps)
To edit text properties in MOLE labels, click the Component drop-down menu to edit the style's component that corresponds to the type text (font text or graphic text) you want:
Any changes you make to components apply to the style whose name appears in the Name drop-down menu. You can edit other styles without losing changes you just made—MOLE retains all changes until you click OK or Cancel.
MOLE applies the changes you made to the map display and the layer.
The next time you save the map, the edits to the style will be saved in the layer of the map. To save the map (the .mxd or .3dd file) click the Save button
The last style you created (or edited) will be the default style MOLE will use to render in the map display all graphic components (for example, all friendly force element fills) for the layer, unless you select a different style in the Name drop-down menu. For more information, see Applying a style.
NOTE: Every style has the same collection of components you can choose to edit (and save with the style), such as fill color, icon fill color, line thickness properties, text properties for labels, and callout line properties.
Applying a style (and changing the default style)
When you apply a style you've created, MOLE applies the style to all force element graphics in the layer, that is, MOLE applies the style to all affected graphic components of all force elements in the layer.
For example, a graphic component property you can set in a style is friendly fill color. When you apply a style that sets friendly fill color to, say, green, MOLE applies a green fill to all friendly force elements in the layer (all force elements in the layer that have an F in the second character of their Symbol_ID codes).
To apply a style
- In the ArcMap (or ArcGlobe) table of contents, double-click the graphics sublayer of the MOLE force element group layer that you want to apply a style to. Tell me how to add a MOLE layer.
- Click the Symbols tab.
- In the Style area, click the Name drop-down arrow and select the style you want to apply. If only one style, Default, is listed, you haven't created any styles yet. Default is a style that strictly adheres to the specification you chose for this layer. Default is always available.
- Click OK.
The MOLE force element Layer Properties dialog box appears.
MOLE applies the style you selected to the map display.
The next time you save the map, the edits to the style will be saved in the layer of the map. To save the map (the .mxd or .3dd file) click the Save button
You can restore the graphics to the layer's military specification setting original style at any time by selecting Default from the Styles drop-down menu.
| Tips |
|
Use styles with tactical graphics
MOLE styles for tactical graphics let you:
- Customize the way tactical graphics in a layer display
- Store the customizations for later use and reuse
A style is a collection of graphic components; each graphic component has settings you specify. When you create or edit a style, you specify settings for its components, one at a time.
Because graphic components are pieces of military symbology, such as line and fill colors, when you edit them, you are likely departing from the military symbol specification you chose for the layer. But this can be helpful. Tell me how.
MOLE styles differ from ArcGIS styles. MOLE styles can be saved only as part of a MOLE layer, through that layer's saved information in an .mxd, .3dd, or .lyr file. Because styles are created and stored in layers, if you want to use a style in layer A that you created in layer B, you must re-create the style in layer A.
The below topics describe how to do the following in ArcMap and ArcGlobe:
Creating a style
- In the ArcMap (or ArcGlobe) table of contents, double-click the graphics layer of the MOLE tactical graphic group layer to which you want to add a style. Tell me how to add a MOLE layer.
- Click the Symbols tab.
- In the Style area, click Add.
- In the New Name text box, highlight the default name New Style, then type a name for the style you are about to create.
- Now you are ready to edit the style by specifying settings for its graphic components. Skip to step 4 of Editing a style.
The MOLE Layer Properties dialog box for tactical graphics appears.
The New Name text box and the Name drop-down menu display the default name for the new style, and the Style Options become available.
The Name drop-down menu's text area displays the name you typed in the previous step, indicating that the new style has been created and is set as the current style for this layer.
Editing a style
When you edit a style, you edit the graphic components in it that you want to change, one at a time.
- In the ArcMap (or ArcGlobe) table of contents, double-click the graphics layer of the MOLE tactical graphic group layer that contains the style you want to edit. Because styles are saved with the map, not with the data, you can edit styles at any time as long as you've opened the .mxd, .3dd, or .lyr file that contains the style you want to edit. Tell me how to open a map. Tell me how to add a MOLE layer.
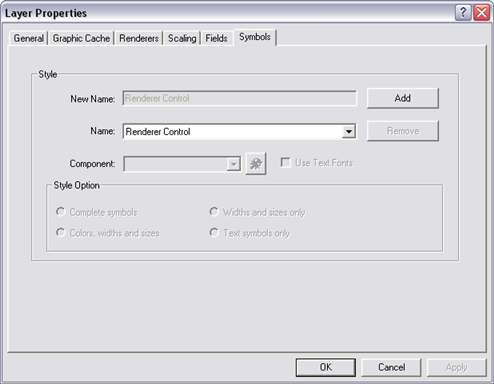
- Click the Symbols tab.
- In the Style area, in the Name drop-down menu, select the name of the style you want to edit. If only one style, Renderer Control, is listed, you haven't created any styles yet. Renderer Control means that the current style is a default style that strictly adheres to the specification you chose for this layer. This default style is always available.
- Edit the style's graphic components, one at a time:
- Click the Component drop-down arrow to select the first graphic component whose properties you want to change for the style.
- In the Properties area, in the Simple Fill tab, click the Outline Color drop-down menu, then select a green color.
- Click OK to close the properties dialog box.
- You can apply style options, which tell MOLE which components it should override when a style setting conflicts with a renderer setting.
- If you want to use fonts instead of graphics for text in MOLE labels, check Use Text Fonts. Graphic text is built by using polygon shapes for each letter of a word; the polygon shapes come from the MOLE AlphaPolygons feature class in the moleCore database. It is vector-based text.
- In the Layer Properties dialog box, click OK.
- MOLE applies the changes you made to the map display.
- When you are finished creating or modifying styles, click OK.
The MOLE tactical graphic Layer Properties dialog box appears.
For example, if you want all point tactical graphics in the layer that have a friendly affiliation (that have an F in the second character of the Symbol_ID field) to have a green outline (border) color, you would click Friendly Fill in the Component drop-down menu.
The properties dialog box for the graphic component you selected appears. If it doesn't, click the Edit Properties button
In the properties dialog box, change settings to reflect how you want to change the graphic component's appearance for this style.
For example, to change the outline color of friendly point tactical graphics (the Friendly Fill item) to green:
The Preview area shows how the changes you made will appear.
Select the next graphic component you want to edit from the Component drop-down menu, then repeat this step (step 4). Repeat this step for as many graphic components as you want to change for this style. When you are finished, continue to step 5.
Note that using graphic components (selecting no color in a component) is one way to use transparency with tactical graphics. Others include interactively revealing layers, and adjusting layer transparency.
Any changes you make to components apply to the style whose name appears in the Name drop-down menu. You can edit other styles without losing the changes you just made—MOLE retains all changes until you click OK or Cancel.
The next time you save the map, the edits to the style will be saved in the layer of the map. To save the map (the .mxd or .3dd file), click the Save button
The last style you created (or edited) will be the default style MOLE will use for all graphic components (for example, all friendly tactical graphic borders) for the layer, unless you select a different style in the Name drop-down menu. For more information, see Applying a style.
Applying a style (and changing the default style)
When you apply a style you've created, MOLE applies the style to all tactical graphics graphics in the layer—or perhaps better said—MOLE applies the style to all affected graphic components of all tactical graphics in the layer.
For example, a graphic component property you can set in a style is friendly fill color. When you apply a style that sets friendly fill color to, say, green, MOLE applies a green fill to all friendly tactical graphics in the layer (all tactical graphics in the layer that have an F in the second character of the Symbol_ID code).
To apply a style
- In the ArcMap (or ArcGlobe) table of contents, double-click the graphics layer of the MOLE tactical graphic group layer that you want to apply a style to. Tell me how to add a MOLE layer.
- Click the Symbols tab.
- In the Style area, click the Name drop-down arrow and select the style you want to apply. If only one style, Renderer Control, is listed, you haven't created any styles yet. Renderer Control means that the current style is a default style that strictly adheres to the specification you chose for this layer. This default style is always available.
- Click OK.
The MOLE tactical graphic Layer Properties dialog box appears.
MOLE applies the style you selected to the map display.
The next time you save the map, the edits to the style will be saved in the layer of the map. To save the map (the .mxd or .3dd file) click the Save button
You can restore the graphics to the layer's military specification setting (original style) at any time by selecting Renderer Control from the Name drop-down menu.
Edit multiple MOLE graphics at once
You can edit multiple MOLE graphics at one time using the ArcMap Attributes tool, provided the graphics are in the same layer. You can make any possible edit to MOLE data this way with the exception of adding table fields.
The disadvantage of editing data this way is that the editing is not user interface based. That is, you are editing values in tables instead of taking advantage of the visual editing capabilities of ArcGIS and MOLE.
-
Add at least one MOLE layer and start an ArcMap edit session.
- You can ensure that you select graphics from only certain layers by highlighting those layers in the table of contents before proceeding. For more information, see Select a MOLE graphic.
- Click the Target drop-down arrow to select the layer that corresponds to the MOLE layer you wish to edit.
- Click the Task drop-down arrow and select Modify Feature.
- On the MOLE toolbar, click the Select Graphics button .
- Press and hold the Shift key.
- In the map display, click the MOLE graphics you want to edit.
- Let go of the Shift key.
- Click the Attributes button
 on the Editor toolbar.
- In the Attributes dialog box (also known as the Object Browser), click to highlight the top level item in the left pane.
- In the Value column (right pane), click a value you want to change or populate.
- Type the new value.
- Repeat the previous two steps until you have finished changing values for the selected graphics.
- Click the x in the upper right corner to close the Attributes dialog box.
You may also have to click to highlight the MOLE tactical graphic or force element graphics layer in the ArcMap table of contents.
The value's box turns into a text entry area, and a text cursor appears in the text entry area.
Your edits are applied to the graphics you selected.
| Tips |
|