Tables and attribute information > Displaying tables and attribute information
Setting field properties, aliases, and table display options |
|
|
Release 9.3
Last modified April 24, 2009 |


Print all topics in : "Displaying tables and attribute information" |
About setting field properties and aliases
Note:
This topic was updated for 9.3.1.
There are table and layer properties that allow you to customize which data can be displayed and how it will be formatted. For example, you may
- Define which fields are displayed (the visible fields).
- Define an alias for a field name so the field appears in the table with a name that is easy to understand. This is helpful because you cannot change the names of fields in your data once they are created.
- Define the formatting for numeric data such as for currency values or to display a relevant number of decimal places. Formatted data appears in the Identify dialog box, legends, the table of contents, table windows, and so on.
- Determine the primary display field, which is used by the Identify window and other dialog boxes.
- Set table display options and work with columns.
These properties are set in several different places including the Layer or Table Properties dialog boxes, the table window, and the Tools > Options dialog box. However, there are some field properties that you cannot change. These include field type, length, precision, and scale.
When you are editing features, the customizations made for the display of attribute data will not be shown in the Attributes dialog box (displayed from the Editor toolbar) because the Attributes dialog box is designed to show the exact setup of the database rather than the user-friendly view you may prefer in your maps.
The primary display field
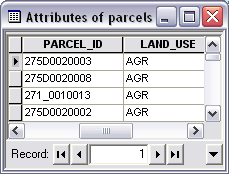
The primary display field is the most useful and unique field of an attribute table or table. For example, the primary display field for a countries layer would be its Name field or the parcel number for a parcels layer.
The primary display field defaults to the first field of string type that contains the text "name" (case insensitive) in the field name. If no "name" field exists, the primary display field defaults to the first field of string type, then the first field of integer type, then the first field of any type. You can change the primary display field from the Fields tab of the Layer or Table Properties dialog box.
The content of a layer's primary display field is used
- To provide text for MapTips, which is the text that's displayed when you hover your mouse pointer over a feature in this layer. You can enable MapTips from the Display tab of the Layer Properties dialog box.
- To represent the feature in the left side of the Identify Results window when you use the Identify tool.
If you are working with a table that has no associated features, the primary display field will be used
- To represent the record in the left side of the Identify Results window when you use the Identify tool on a record in a table. You can find this tool by opening the table and right-clicking in the first column of the table.
Field aliases
An alias is an alternative name for a field: a more user-friendly description of the content of the field. Unlike true names, aliases do not have to adhere to the limitations of the database, so they can contain special characters such as spaces. By specifying an alias, you can give names to fields that are more descriptive than their actual field name. For example, you might specify an alias of "Date of deed" for a field stored in the geodatabase as "DEED_DATE".
Once you create a field, you cannot rename it. You can, however, specify an alias (or you could create a new field with the name you want and delete the old field).
There are two types of field aliases: feature class field aliases (geodatabase only) and layer field aliases. You work with feature class field aliases in ArcCatalog on the Feature Class Properties dialog box. When a geodatabase feature class is added to ArcMap, its field aliases are used initially for the layer field aliases. However, after this, there is no link between the two. Properties set in ArcMap will override the properties of the data source, but they will not be carried back to the data source. This means that if you change a layer field alias, it will not change the feature class field alias, and if you change a geodatabase field alias, it will not update the layer field alias for any existing layers based on the feature class.
You can only maintain what you set on the Fields tab by saving the map document or the layer to a .lyr file.
Table display options
When you open a table, you can customize its appearance in a variety of ways. For example, if you don't like the default table font, you can change it and set the font size as well. You can make changes for all tables or just one—each table can have its own individual settings.
When examining an individual table's contents, you can resize columns to better see their values. You can also reposition them to compare the values in one field to the values in another. Freezing a table's columns can be helpful when you're exploring its contents. Frozen columns are locked in position at the left of the table and are separated from the other columns by a heavy black line. When scrolling horizontally, all other columns move normally, but the frozen columns remain fixed.
Some of the display options you can set include
- Changing the width of the visible fields and rearranging them
- Freezing a field so that you always see it as you scroll across the table
- Choosing whether to show the values or the descriptions for fields with subtypes or domains
- Changing the color or font that is used to display attributes in tables
- Setting table header and cell heights
- Setting the character that indicates that a field is indexed (indexes can improve the performance of queries)
It's easy to work with table windows when you make them small to fit on your screen. If the Options menu button is hidden due to the width of the table window, a small control appears at the bottom right hand corner of the window. You can click this control to access the Options menu. You can also right-click any of the empty gray space at the bottom of the table to access the Options menu.
Setting column header and cell heights
You can change the heights of the column headers (the row along the top of the table window that shows you the names of the fields) and cells. By increasing these values, you can increase the height of the rows.
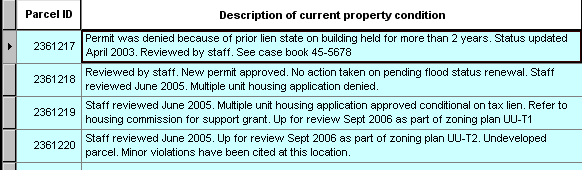
If the value you specify for the column header or cell height provides enough space to accommodate additional lines, the field name inside the column header or the content in the cell will wrap if it exceeds the current width of the column. This is particularly useful if your table contains long field names or long text fields such as description or comment fields. Increasing the header or cell height in your table can make these fields easier to read.
The default height of a header is 125% of the font size. The default cell height is 115% of the font size. If you set the cell height value to be below 115%, it can prevent the insertion bar appearing when you try to edit the contents of cells.
You should normally leave the default header height at 125% and the default cell height at 115% in the Tables tab of the Tools menu > Options dialog box, so all the new tables you create use this standard setting. If you want a particular table to have taller rows so long text fields wrap around as shown above, specify the setting through the table window's Options > Appearance dialog box. In this way, the setting will just apply to that particular table.
Quickly setting field properties and aliases
With the table window open, you can right-click a field heading and click Properties to open a dialog box that allows you to set and view certain properties of that field. This dialog box lets you specify a field alias; turn the field on or off; make that field the primary display field; change its number format if it is not a string field; and review (but not change) the field's other data properties, such as whether it allows null values, and its precision and scale.
Setting column widths
In the table window, fields are shown in columns. You can drag the column dividers between fields left and right to change their width including dragging dividers so that fields are completely hidden.
You can also automatically reset the column widths to undo changes you made. The Restore Default Column Widths command in the Options menu resets all the columns to their default widths. This also reveals any fields that are completely hidden because their column has been dragged to have no width. The Restore Default Column Widths command doesn't reset the field order, so if you have dragged and dropped fields around in the table window, this reordering is preserved when you use the command.
If a field has been completely hidden in the table, you'll see a thicker column divider at that position. This makes it easy to see where one or more fields have been hidden. If several fields have been hidden at that position, you'll see an even thicker divider.
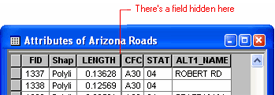
To unhide a hidden field, drag the thick divider to the right, or double-click on the divider. To reveal all hidden fields, use the Restore Default Column Widths command in the Options menu. Completely hiding fields in the table window is useful because it lets you choose how you want the table to appear, including how it appears when you use the new Print command in the Options menu to print the table, without turning fields off completely, which would prevent them being listed elsewhere.
How to set field properties and aliases
Setting the primary display field
- If the field is in a layer's attribute table, right-click the layer in the table of contents and click Properties.
If the field is in a table without features, click the Source tab in the table of contents, right-click the layer in the table, then click Properties. - Click the Fields tab in the Properties dialog box.
- Click the Primary display field drop-down arrow and click a field.
- Click OK.
| Tip |
|
Setting whether fields are visible
- Open the table.
- Right-click the field heading and click Turn Field Off.
| Tips |
|
Setting field aliases
- Open the table.
- Right-click a field heading and click Properties.
- Type an alias.
- Click OK.
| Tips |
|
Formatting numeric fields
- Open the table.
- Right-click a field heading and click Properties.
- Click the Number Format ellipsis button
 .
.
- Set the category and options you want to use in the Number Format dialog box.
Each number format category has its own set of available formatting options. For example, with the Numeric category, you can specify the number of decimal places or significant digits to display and the alignment of the cell and turn on or off options for showing thousands separators, padding with zeros, and a plus sign for positive numbers. - Click OK on all dialog boxes.
| Tips |
|
Setting the selection and highlight color for tables
- To set the default selection and highlight color for all tables, click the Tools menu, click Options, and click the Tables tab.
To set the selection and highlight color for an individual table, click Options on the table window and click Appearance. - Click the Selection Color drop-down arrow and click the color you want to use.
- Click the Highlight Color drop-down arrow and click the color you want to use.
- Click OK.
| Tips |
|
Setting other table display options
- For the default settings for all tables, click the Tools menu, click Options, and click the Tables tab.
For an individual table, click Options on the table window and click Appearance. - To set the text font and size, click the Table Font drop-down arrow and click the font you want to use. Click the Table Font Size drop-down arrow and click a point size.
- To set the column header height at the top of the table and the height of rows in the table, type values for the percentage of font size.
- To set the character used when indicating whether a column has an index associated with it, type the character. Uncheck Mark indexed fields with if you prefer not to see which columns are indexed.
- To set the character used when indicating the primary display field, type the character. Uncheck Mark primary display field with if you prefer not to see which column is the primary display field.
- To set subtype and domain options, check Display coded value domain and subtype descriptions and check the box to validate records automatically.
- Click OK.
| Tips |
|
Changing a column's width
- Position the mouse pointer to the edge of the column you want to resize.
The pointer's icon changes. - Click and drag the column's edge to the desired width.
A black line indicates where the edge of the column will be located. - Drop the edge of the column.
The column is resized.
| Tip |
|
Rearranging a table's columns
- Click the heading of the column you want to move.
- Click and drag the column's heading.
A red line indicates where the column will be positioned. - Drop the column.
After you drop it, the column appears in the new position.
Freezing a column
- Click the heading of the column you want to freeze.
- Right-click the selected column's heading and click Freeze/Unfreeze Column.
The column is now frozen.
| Tips |
|