Show Navigation
|
Hide Navigation
You are here:
Tables and attribute information > Displaying tables and attribute information
Tables and attribute information > Displaying tables and attribute information
Viewing statistics for a table |
|
|
Release 9.3
Last modified April 24, 2009 |


Print all topics in : "Displaying tables and attribute information" |
Related Topics
About viewing statistics for tables
Note:
This topic was updated for 9.3.1.
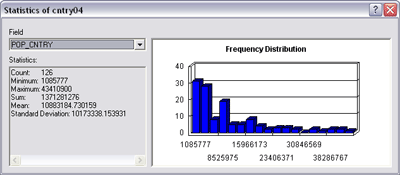
When exploring a table, you can get statistics describing the values in numeric columns. You'll see how many values the column has, as well as the sum, minimum, mean, maximum, and standard deviation of those values. A histogram is also provided showing how the column's values are distributed. Statistics are calculated for all numeric columns in the table. To see a description of another column's values, click its name in the Field drop-down list.

How to view statistics for tables
- Right-click the heading of a field that contains numeric data and click Statistics.
In the Statistics dialog box, you'll see information about the values in the field whose heading you clicked. - If you want to see statistics for another numeric field, click the Field drop-down arrow and click the field's name.
- Click the Close button when you are finished exploring statistics.
| Tip |
|