KML elements |
|
|
Release 9.3
Last modified October 13, 2010 |


|
The goal of this topic is to give you a quick overview of the types of data elements that you can publish using KML.
Keyhole Markup Language (KML) is a language that enables you to present your GIS data as a series of graphics within Google Earth™, Google Maps™, and other web-based mapping applications that support KML (e.g., ArcGIS Explorer). In addition, you can define how to explore and interact with your KML elements within the Google Earth™ and Google Maps™ context. For example, what will happen when you click or pause on a KML graphic location?
The KML structure is quite flexible and web-friendly. In addition, KML content can be quite rich. It supports many data types and a number of interactive query operations. Therefore, it's useful to understand how to translate your geographic information into KML graphic elements and to define the exploration and interaction behavior you want to provide for users to work with your GIS data through KML.
Quick overview
ArcGIS supports a number of key KML capabilities. Here is a quick review.
| ArcGIS data types | KML elements |
| Point features | Placemarks |
|
|
Or, you can use a KML ground overlay to display a collection of points as an image |
| Line features | Paths ** |
|
|
Or, you can use a KML ground overlay to display a collection of paths as an image. |
| Polygon features | Polygons ** |
|
|
Or, you can use a KML ground overlay to display a collection of polygons as an image. |
| Imagery | Ground overlays |
| Map documents | Each layer can be displayed separately. Feature classes are displayed as KML features. Imagery and rasters as ground overlays. |
|
|
Or, the entire map can be displayed as an image by choosing to use a KML ground overlay. |
|
Map and screen graphics (e.g., logos, map legends, pictures, and so forth)
|
KML Screen Overlays
Elements such as symbol legends, logos, and pictures can be displayed using KML Screen Overlays. |
KML placemarks (Points)
KML placemarks are symbolized point locations on a 2D or 3D map. They have two primary roles:
- They are used to symbolize and display point features.
- They define how users interact with all types of geographic features (e.g., points, lines, and polygons). Information about each feature can be accessed through a placemark located with each feature. By clicking a placemark, you can access attribute information, an HTML Web page or document, and view photographs, charts, and other feature information.

Image courtesy of Google Earth(TM)
Typically, each placemark has an associated 2D or 3D symbol, a text label, and placement properties that identify and locate each placemark on the GIS feature in the Google Earth™ or Google Maps™ display.
Placemarks can also be used to control fly-to and camera location settings. For example, the placemark can act as a kind of feature bookmark in Google Earth™.
Delivering HTML content using KML
KML is an effective mechanism for associating HTML content with your GIS features through the use of KML placemarks. One of the key aspects of placemarks is the ability to use balloon-style popups for information display of feature attributes and other information.
A key capability is the use of HTML formatting of the information. For example, you can display web page contents for each feature in your map, such as the HTML page for conservation sites that is shown in the example below.
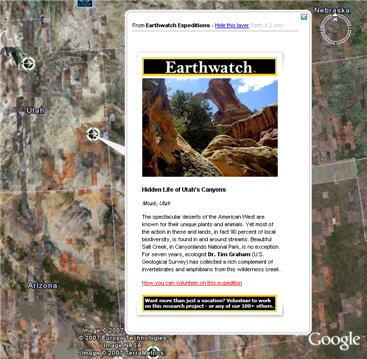
Image courtesy of Google Earth(TM)
Features in KML
In a manner similar to the way you work with feature layers in ArcMap and ArcGlobe, KML can portray the contents of your GIS map layers as symbolized points, lines, polygons, and multipatches. Using KML, you set properties for how features are to be portrayed. However, the mechanism used for identification and interaction in KML is different from ArcGIS. In KML, each feature can have an associated KML placemark that enables feature identification and interaction.
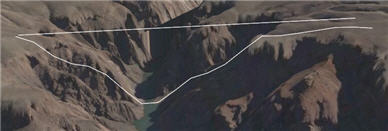
Image courtesy of Google Earth(TM)
Examples of KML paths used to display line features. One line is draped on the terrain and the other is placed to float on top of the terrain. The use of KML paths is a common way to display GIS line features.
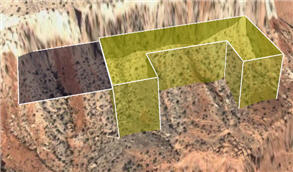
Image courtesy of Google Earth(TM)
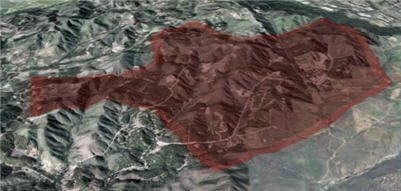
Image courtesy of Google Earth(TM)
Examples of KML polygons. Both polygons in the top image are floating above the earth's surface, with the right polygon being extruded down to the surface. The lower image shows a polygon draped onto the earth's surface.
Use KML placemarks to provide access to feature attribute information.
Placemarks provide the primary mechanism to access feature attributes and other information. When you are designing KML presentations of your GIS data, consider how you want to use placemarks for enabling access to feature attribute information and how users will interact with your features.
NOTE: When using KML polygons, you can use CTRL-Click on polygons to display feature information in a balloon popup
KML ground overlays
KML ground overlays are used to display aerial imagery as well as static map images that are draped onto the globe surface. Ground overlays can be used to add your more detailed and up-to-date orthoimagery or to generate thematic map information as a raster picture that can be placed on the Google basemap.
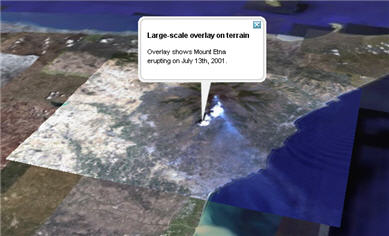
Image courtesy of Google Earth(TM)
Ground overlays are commonly used in combination with other KML elements. For example, features can be draped onto the ground overlay and can include the use of placemarks for map query and identification.
Textured 3D models in KML
Using KML, you can import 3D models in the COLLADA interchange file format.
Three-dimensional objects (such as buildings, trees, and airplanes) can be modeled naturally with photorealistic representations. Many users build 3D models of their buildings, and places of interest.
KML supports COLLADA, and models from a number of 3D graphics applications can be exported to COLLADA -- for example, from applications such as Google SketchUp™, 3ds max (formerly known as 3D Studio Max from AutoDesk), and OpenFlight.
Once exported, COLLADA interchange files (.dae) can be imported into Google Earth™ using KML and located using placemarks.
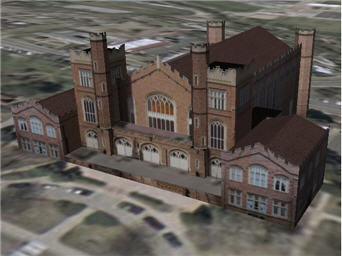
Image courtesy of Google Earth(TM)
You can also use placemarks to provide access to additional descriptive information for the 3D models displayed using KML.
Exporting ArcGIS multipatch geometries to Google Earth
ArcGIS uses multipatch geometries to represent 3D solid objects as shells, which can be used to create 3D models in these graphic applications. For example, the Google SketchUp™ program has an importer for multipatches to be brought in. These can be textured (or "skinned") with a photorealistic appearance and published to KML using COLLADA.
KML screen overlays
KML screen overlays are page graphics that pop up at predefined locations on the Google Earth™ screen. These are not part of the geographic display but are useful within a GIS context as information displays. For example, you can use screen overlays to present a symbol key, map legend, or company logo.
Here is an example of a screen overlay using the ESRI corporate logo. The logo graphic element remains fixed in the display if the globe is navigated. Because it is an element in the KML Contents list, its visibility can be turned on or off.
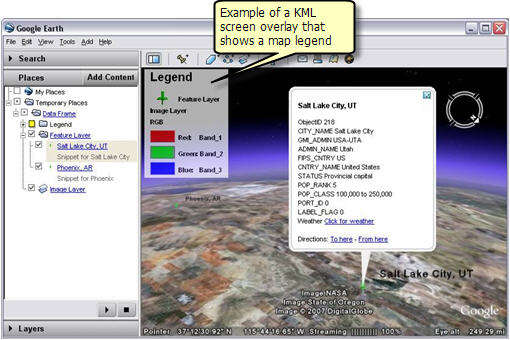
Image courtesy of Google Earth(TM)
KML regions
KML regions allow you to add large datasets to Google Earth™ and Google Maps™ without sacrificing performance. The data is not displayed until you zoom into an appropriate map resolution. Regions are useful for managing the display of multi-resolution map information such as image pyramids for a specific extent.
Data at each resolution is drawn only when it falls within the user's view and occupies a certain portion of the screen. Using regions, you can supply multiple levels of detail for your data, so that higher resolution datasets are added as you zoom in. Data for each level of detail is displayed automatically at the appropriate screen resolution.
Some of the types of ArcGIS content that you may want to serve using KML regions includes:
- Image pyramids
- ArcGIS Server Map Caches with multiple levels of detail
- Group layers that are designed with scale thresholds. More detailed displays are used to depict the data theme as you zoom in (e.g., only highways at a zoomed out scale, add major roads at a larger map scale, and add city streets at a more detailed map scale).
Support for KML regions is provided as a core capability in ArcGIS Server as the mechanism to dynamically serve large GIS datasets using KML. See KML support in ArcGIS Server for more information.
KML network links
KML network links are the mechanism used to reference data that is being served dynamically on the web. This makes it possible for multiple clients to view the same network-based or web-based KML information and to automatically access content that is served dynamically.
The ability to retrieve up-to-date information as it changes is important in many applications. Instead of publishing KML to a static file, you can use ArcGIS Server to serve maps and other information dynamically using KML. This helps to ensure that KML data services are up-to-date.
KML network links enable you to specify how often to refresh the data being served.