Topics for:
Designing a geodatabase
Note:
This topic was updated for 9.3.1.
An overview of geodatabase design
Geodatabase design is based on a common set of fundamental GIS design steps, so it¨s important to have a basic understanding of these GIS design goals and methods. This section provides an overview.
GIS design involves organizing geographic information into a series of data themes—layers that can be integrated using geographic location. So it makes sense that geodatabase design begins by identifying the data themes to be used, then specifying the contents and representations of each thematic layer.
This involves defining
- How the geographic features are to be represented for each theme (for example, as points, lines, polygons, or rasters) along with their tabular attributes
- How the data will be organized into datasets such as feature classes, attributes, raster datasets, and so forth
- What additional spatial and database elements will be needed for integrity rules, for implementing rich GIS behavior (such as topologies, networks, and raster catalogs), and for defining spatial and attribute relationships between datasets
Representation
Each GIS database design begins with deciding what the geographic representations will be for each dataset. Individual geographic entities can be represented as
- Feature classes (sets of points, lines, and polygons)
- Imagery and rasters
- Continuous surfaces that can be represented using features (such as contours), rasters (digital elevation models [DEM]), or triangulated irregular networks (TINs) using terrain datasets
- Attribute tables for descriptive data
Data themes
Geographic representations are organized in a series of data themes (sometimes referred to as
thematic layers). A key concept in a GIS is one of data layers or themes. A data theme is a collection of common geographic elements such as a road network, a collection of parcel boundaries, soil types, an elevation surface, satellite imagery for a certain date, well locations, and so on.
The concept of a thematic layer was one of the early notions in GIS. Practitioners thought about how the geographic information in maps could be partitioned into logical information layers—as more than a random collection of individual objects (such as a road, a bridge, a hill, a house, a peninsula). These early GIS users organized information in thematic layers that described the distribution of a phenomenon and how it should be portrayed across a geographic extent. These layers also provided a protocol (capture rules) for collecting the representations (as feature sets, raster layers, attribute tables, and so on).
In GIS, thematic layers are one of the main organizing principles for GIS database design.
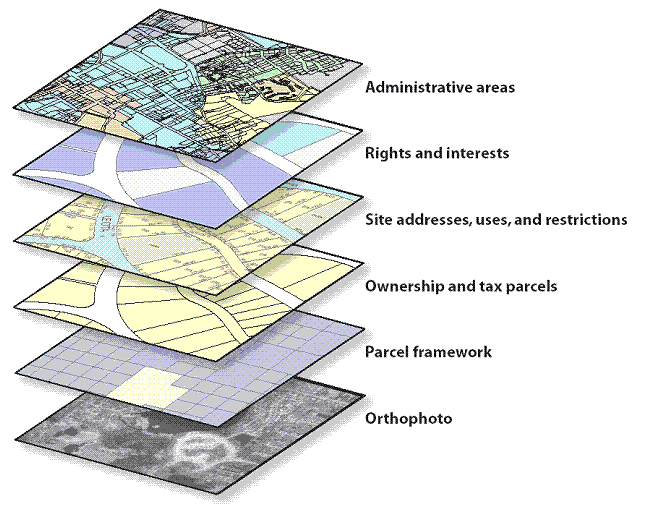
Each GIS will contain multiple themes for a common geographic area. The collection of themes acts as layers in a stack. Each theme can be managed as an information set independent of other themes. Each has its own representations (points, lines, polygons, surfaces, rasters, and so on). Because the various independent themes are spatially referenced, they overlay one another and can be combined in a common map display. Plus, GIS analysis operations, such as overlay, can fuse information between themes.
GIS datasets are collections of representations for a data theme
Geographic data collections can be represented as feature classes and raster-based datasets in a GIS database.
Many themes are represented by a single collection of homogeneous features such as a feature class of soil type polygons and a point feature class of well locations. Other themes, such as a transportation framework, are represented by multiple datasets (such as a set of spatially related feature classes for streets, intersections, bridges, highway ramps, and so on).
Raster datasets are used to represent continuous surfaces, such as elevation, slope, and aspect, as well as to hold satellite imagery, aerial photography, and other gridded datasets (such as land cover and vegetation types).
Both the intended use and existing data sources influence spatial representations in a GIS. When designing a GIS database, users have a set of applications in mind. They understand what questions will be asked of the GIS. Defining these uses helps determine the content specification for each theme and how each is to be represented geographically. For example, there are numerous alternatives for representing surface elevation: as contour lines and spot height locations (such as hilltops, peaks), as a continuous terrain surface (a TIN), or as shaded relief. Any or all of these may be relevant for each particular GIS database design. The intended uses of the data will help to determine which of these representations will be required.
Frequently, the geographic representations will be predetermined to some degree by the available data sources for the theme. If a preexisting data source was collected at a particular scale and representation, it will often be necessary to adapt your design to use it.
Individual GIS datasets often are collected in concert with other data layers
While each GIS dataset can be used independently of other GIS data, it is often quite important to collect datasets in concert with other information layers so that the fundamental spatial behavior and spatial relationships are maintained and consistent between the related GIS data layers. Here are a few examples that help illustrate this concept:
- Hydrological information about watersheds and drainage basins should be collected in unison with the drainage network. Drainage lines should fit within the basins. All these layers should fit into the surface representation of the terrain.
- Various data layers in a parcel fabric should be collected in concert with other cadastral layers and with underlying survey information so that parcel features fit into the survey control framework. Numerous other feature sets, such as rights-of-way, easements, and zoning classes, are compiled so that they fit onto the parcel fabric.
- The spatial relationships between elevation, land form, soil type, slope, vegetation, surficial geology, and other terrain properties are typically compiled in unison to characterize environmental resource units. Understanding the science behind these spatial relationships helps build a consistent, logical database where features from each data layer are consistent with each other.
- Topographic basemap information is compiled in an integrated manner. Hydrography, transportation, structures, administrative boundaries, and other topographic map layers are compiled in unison. These cartographic representations in the map display are built in an integrated manner in order to communicate clearly and accurately and to draw attention to key map locations.
In each of these cases, there is a data model that defines a collection of related data themes that fit into an overall information framework. Each framework is essentially a collection of related data themes that are best captured in unison with each other. The data capture guidelines follow sound scientific principles about their spatial behavior and relationships. Each theme plays an important part in the holistic characterization of a particular
landscape. For example:
-
Terrain landscape: Topographic maps, elevation, drainage network, transportation network, map features, cross-country movement, etc.
-
Urban landscape: Buildings, critical infrastructure, etc.
-
Imagery landscape: Satellite and aerial, local, regional, and national assets, etc.
-
Human landscape: Demographics (population characteristics), cultural centers, citizens, administrative districts and zones, etc.
-
Workforce landscape: Mobile workforce tracking, service centers, traffic conditions, warehouses, etc.
-
Sensor landscape: Camera locations, devices, etc.
-
Operations and plans landscape: Zones of control, planned movements, response, etc.
This concept of collecting integrated data themes in unison is one of the key design principles used in each of the
ArcGIS Data Models.
Note:
This topic was updated for 9.3.1.
Design starts with thematic layers. First, you identify the thematic layers you¨ll need for your particular application and information requirements. What are the data themes that make up your key landscapes? Then, you define each thematic layer in more detail. The characterization of each thematic layer will result in a specification of standard geodatabase data elements such as feature classes, tables, relationship classes, raster datasets, subtypes, topologies, domains, and so on.
When identifying thematic layers in your design, try to characterize each theme in terms of its visual representations, its expected uses in the GIS, its likely data sources, and its levels of resolution. For example, at what scales and extents will you need to use this information, and how will its elements be represented at each scale? These characteristics help describe the high-level contents expected from each theme.
Here is an example description of a data theme for ownership parcels in a cadastral application:
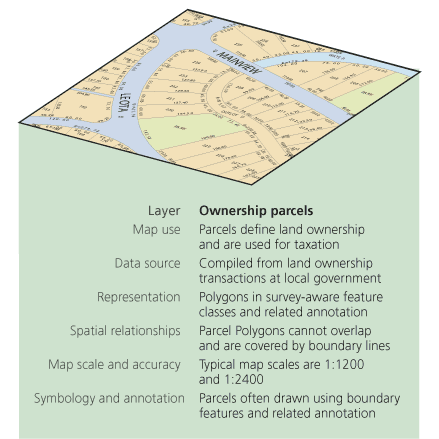
Once you have identified the key thematic layers in your design, the next step is to develop specifications for representing the contents of each thematic layer in the physical database.
- List the map scales and extents that you¨ll need to work with.
- For each, describe how the geographic features are to be represented (for example, as points, lines, polygons, rasters, surfaces, or tabular attributes).
- How should the data be organized into feature classes, tables, and relationships?
- How will spatial and database integrity rules be used to implement GIS behavior?
The 11 steps presented below outline a general GIS database design process. The initial design steps 1 through 3 help you identify and characterize each thematic layer. In steps 4 through 7, you begin to develop representation specifications, relationships, and ultimately, geodatabase elements and their properties. In steps 8 and 9, you will define the data capture procedures and assign data collection responsibilities. In the final stage (steps 10 and 11), you will test and refine your design through a series of initial implementations. In this final phase, you will also document your design.
Eleven steps to geodatabase design
|
1.
|
Identify the information products that you will create and manage with your GIS.
Your GIS database design should reflect the work of your organization. Consider compiling and maintaining an inventory of map products, analytic models, Web mapping applications, data flows, database reports, key responsibilities, 3D views, and other mission-based requirements for your organization. List the data sources you currently use in this work. Use these to drive your data design needs.
Define the essential 2D and 3D digital basemaps for your applications. Identify the set of map scales that will appear in each basemap as you pan, zoom, and explore its contents. |
|
2.
|
Identify the key data themes based on your information requirements.
Define more completely some of the key aspects of each data theme. Determine how each dataset will be used—for editing, GIS modeling and analysis, representing your business workflows, and mapping and 3D display. Specify the map use, the data sources, and the spatial representations for each specified map scale; data accuracy and collection guidelines for each map view and 3D view; how the theme is displayed, its symbology, text labels, and annotation. Consider how each map layer will be displayed in an integrated fashion with other key layers. For modeling and analysis, consider how information will be used with other datasets (for example, how they are combined and integrated). This will help you to identify some key spatial relationships and data integrity rules. Ensure that these 2D and 3D map display and analysis properties are considered as part of your database design. |
|
3.
|
Specify the scale ranges and the spatial representations of each data theme at each scale.
Data is compiled for use at a specific range of map scales. Associate your geographic representation for each map scale. Geographic representation will often change between map scales (for example, from polygon to line or point). In many cases, you may need to generalize the feature representations for use at smaller scales. Rasters can be resampled using image pyramids. In other situations, you may need to collect alternative representations for different map scales. |
|
4.
|
Decompose each representation into one or more geographic datasets.
Discrete features are modeled as feature classes of points, lines, and polygons. You can consider advanced data types such as topologies, networks, and terrains to model the relationships between elements in a layer as well as across datasets.
For raster datasets, mosaics and catalog collections are options for managing very large collections.
Surfaces can be modeled using features, such as contours, as well as using rasters and terrains. |
|
5.
|
Define the tabular database structure and behavior for descriptive attributes.
Identify attribute fields and column types.
Tables also might include attribute domains, relationships, and subtypes. Define any valid values, attribute ranges, and classifications (for use as domains). Use subtypes to control behaviors. Identify tabular relationships and associations for relationship classes. |
|
6.
|
Define the spatial behavior, spatial relationships, and integrity rules for your datasets.
For features, you can add spatial behavior and capabilities and also characterize the spatial relationships inherent in your related features for a number of purposes using topologies, address locators, networks, terrains, and so on. For example, use topologies to model the spatial relationships of shared geometry and to enforce integrity rules. Use address locators to support geocoding. Use networks for tracing and path finding. For rasters, you can decide if you need a raster dataset or a raster catalog. |
|
7.
|
Propose a geodatabase design.
Define the set of geodatabase elements you want in your design for each data theme. Study existing designs for ideas and approaches that work.
Copy patterns and best practices from the ArcGIS Data Models. |
|
8.
|
Design editing workflows and map display properties.
Define the editing procedures and integrity rules (for example, all streets are split where they intersect other streets and street segments connect at endpoints).
Design editing workflows that help you to meet these integrity rules for your data.
Define display properties for maps and 3D views.
Determine the map display properties for each map scale. These will be used to define map layers.
|
|
9.
|
Assign responsibilities for building and maintaining each data layer.
Determine who will be assigned the data maintenance work within your organization or assigned to other organizations. Understanding these roles is important. You will need to design how data conversion and transformation is used to import and export data across various partner organizations. |
|
10.
|
Build a working prototype. Review and refine your design.
Test your prototype design. Build a sample geodatabase copy of your proposed design using a file, personal, or ArcSDE Personal geodatabase. Build maps, run key applications, and perform editing operations to test the design¨s utility. Based on your prototype test results, revise and refine your design. Once you have a working schema, load a larger set of data (such as loading it into an ArcSDE geodatabase) to check out production, performance, scalability, and data management workflows.
This is an important step. Settle on your design before you begin to populate your geodatabase. |
|
11.
|
Document your geodatabase design.
Various methods can be used to describe your database design and decisions. Use drawings, map layer examples, schema diagrams, simple reports, and metadata documents.
Some users like using UML. However, UML is not sufficient on its own. UML cannot represent all the geographic properties and decisions to be made. Also, UML does not convey the key GIS design concepts such as thematic organization, topology rules, and network connectivity. UML provides no spatial insight into your design.
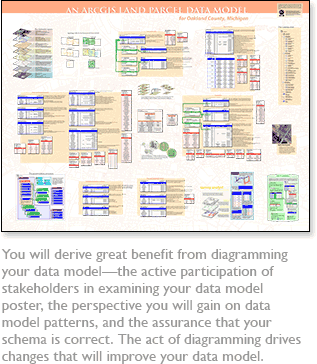
Many users like using Visio to create a graphic representation of their geodatabase schema such as those published with the ArcGIS data models. ESRI provides a tool that can help you capture these kinds of graphics of your data model elements using Visio. Refer to the topic Documenting your geodatabase design. |
Note:
This topic was updated for 9.3.1.
ESRI, along with its user community, has invested a significant amount of time to develop a series of geodatabase data model templates that provide a jump start for your geodatabase designs. These designs are described and documented at http://support.esri.com/datamodels.
At this Web site, you can find existing geodatabase templates as well as useful documentation on geodatabase design for many industries and applications. These models typically are a good starting point. Most users start with these design templates, then refine and extend them to meet their specific needs and requirements.
Once you find a relevant data model, you can download a geodatabase template from the site that you can use to jump-start your design. You can build a test geodatabase, load some data into it, and then test and refine the design for use within your GIS.
Steps in using an ArcGIS data model as the basis for your design
The steps involved in using an ArcGIS data model are very similar to how you might import and modify any existing geodatabase design.
- Download the appropriate data model from the ESRI Support Center at http://support.esri.com/datamodels.
- Create an empty test geodatabase as a file geodatabase.
- Import the schema and set up the appropriate spatial reference for its contents. See Copying the schema of a geodatabase.
- Load some of your existing datasets into your new, empty geodatabase.
- Test and refine your design as appropriate.
Note:
This topic was updated for 9.3.1.
Documenting your geodatabase design is important. At the ArcGIS data models Web site (http://support.esri.com/datamodels), a series of diagrams is used to represent the key design concepts and to document the specifications of geodatabase elements, metadata, and map layers in each of the data model templates. This section provides a short overview for how various geodatabase elements are presented at the Web site and may be helpful as you document your own designs.
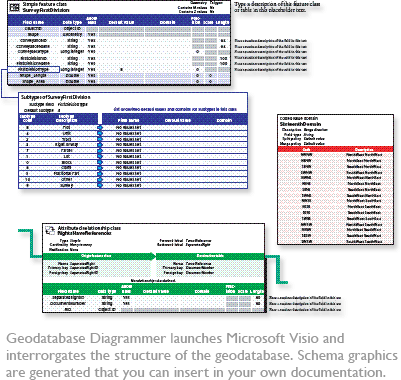
There are six key elements to represent the contents of your geodatabase design. These include
-
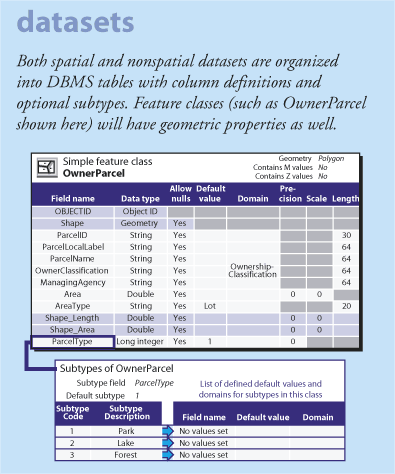
Datasets—These are specifications for how to record the properties of feature classes, rasters, and attribute tables as well as the set of columns in each table. For spatial representations, you¨ll see some geometric properties (such as point, line, and polygon and types of coordinates). Often, you¨ll see a specification for subtypes. These parts of the schema diagram are always shown in blue.
-
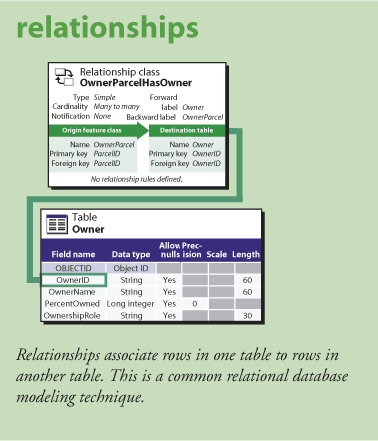
Relationship Classes—Attribute relationships are widely used in GIS, just as they are in all DBMS applications. They define how rows in one table can be associated with rows in another table. Relationships have a direction of cardinality and other properties (for example, is this a one-to-one, one-to-many, or many-to-many relationship?). Relationships and their properties are shown in green.
-
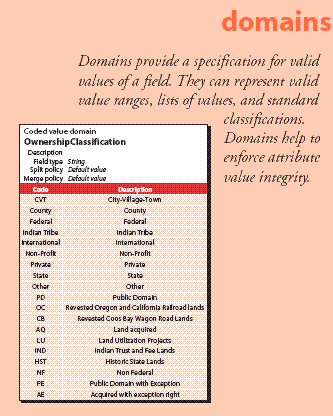
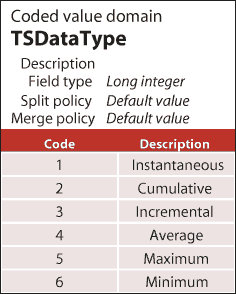
Domains—These represent the list or range of valid values for attribute columns. These rules control how the software maintains data integrity in certain attribute columns. Domains are shown in red.
-
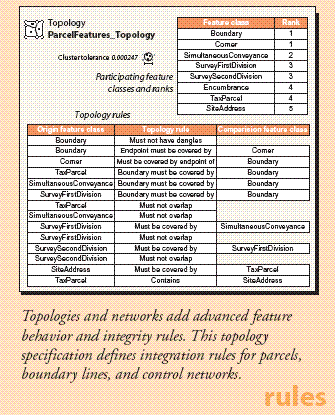
Spatial Relationships and Spatial Rules—A number of advanced data modeling capabilities are available for geodatabases. For example, data elements, such as topologies and their properties, are used to model how features share geometry with other features. Topologies, along with network datasets, address locators, terrains, cartographic representations, geometric networks, and many other advanced geodatabase types, provide a very critical and widely used GIS mechanism to enable spatial behaviors and to enforce integrity in GIS databases. These and other rules, such as networks, are shown in orange.
The best way to think about how to document and describe the set of extended data types in the geodatabase is to describe their rules and the behaviors of the spatial relationships. The following is an example of how a topology can be documented:
-
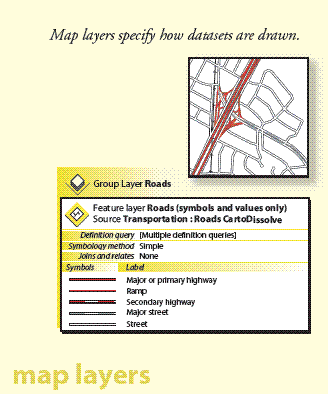
Map Layers—GIS includes interactive maps and other views. A critical part of each dataset is the specification for how it is symbolized and rendered in maps. These are typically defined as layer properties in ArcMap, which specify how features are assigned map symbology (colors, fill patterns, line and point symbols) and text labels. Layers are not managed in geodatabases but are an important aspect in helping to define some key dataset properties in a geodatabase schema. Layer specifications are shown in yellow. Layers can be stored as .lyr files or as elements in an ArcMap document (.mxd). See Adding layers to a map for more information on map layers.
-
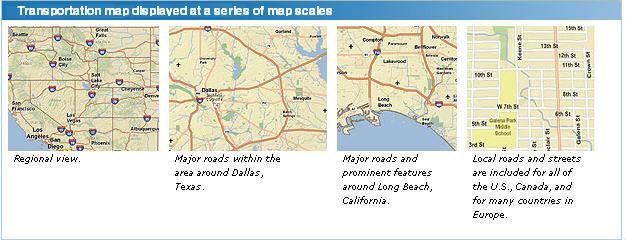
2D and 3D Basemaps—Define the fundamental basemap displays and determine if this data theme will be used in these interactive map displays. If this is the case, it is important to define the set of map scales for your basemaps and the map display properties at each map scale. You¨ll essentially define a different map specification for each map scale and define map layers for each scale.
Using Microsoft Visio and the Geodatabase Diagrammer tool
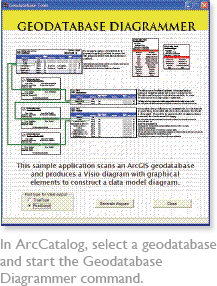
ESRI provides a diagramming utility as a download for users who want to generate graphics similar to these for their geodatabase designs. You can download a tool, Geodatabase Diagrammer, that will generate a series of Visio graphics of your datasets and elements in your geodatabase. Search for "Geodatabase Diagrammer" at
http://arcscripts.esri.com.
This tool is used to create graphical elements in Visio of your geodatabase contents. You can easily cut and paste graphics from Visio into Microsoft Word, PowerPoint, and any application that accepts .wmf files.
Documenting additional properties of your geodatabase design
Other key properties of your geodatabase design should be considered and documented including
- The definition of your coordinate system and spatial properties for each dataset; includes such properties as the map projection, the coordinate system, spheroid, datum, x,y units, vertical coordinate system, and the use of z and m properties
- Key tolerances and the coordinate resolution for each dataset
- The data sources and data compilation workflows; includes translation scripts, geoprocessing and transformation models, and the workflows used to build and maintain the dataset
- Metadata documentation for each dataset
Note:
This topic was updated for 9.3.1.
The following are some useful design tips for modeling geodatabase feature classes:
Task 1. Design simple feature classes.
Almost without exception, every geodatabase will contain feature classes. You may want only a simple geodatabase design that contains just a collection of feature classes. However, most users will find the need to develop a more comprehensive data model that adds advanced geodatabase elements. You will make the decision to extend your simple feature class designs based on your system needs and goals; you¨ll extend your design to support essential GIS functionality and behavior. This section introduces many of these feature class capabilities and points you to help topics where you can get more information on each option.
Start by defining the common properties of simple feature classes. You can add to this later as needed, but focus on defining your basic design first.
A feature class is a collection of geographic features with the same geometry type (such as point, line, or polygon), a common set of attribute columns, and the same coordinate system.
Example feature classes in ArcGIS
| Street centerlines |
Line |
Street segments split at each intersection; usually contain address ranges and network properties |
| Wells |
Point |
|
| Soil types |
Polygon |
Usually have many descriptive attributes in related tables |
| Parcels*
|
Polygon |
Topologically integrated with parcel boundaries and corners |
| Parcel boundaries*
|
Line |
Has coordinate geometry and dimension attributes; participates in a topology with parcels and corners |
| Parcel corners*
|
Point |
Surveyed corners of parcels; participates in a topology with parcel polygons and boundaries |
| Parcel annotation |
Annotation |
Provides text labels for lot dimensions, taxation, and legal description information |
| Building footprints |
Polygon |
Contains outlines of buildings and structures |
* The Cadastral Fabric dataset provides parcel behavior and specialized parcel-based topology for these feature classes.
Once you settle on a proposed list of feature classes, try to define the following for each:
- Pick a geometry type (also known as the feature class type) such as point, line, polygon, or annotation. You¨ll need to use one common geometry type for all the features in each feature class. See Feature class basics.
- Determine the attribute fields and column types. See Geodatabase field data types.
- Determine geometry properties. Will you have z-coordinates? M-coordinates? What kind of coordinate resolution? What kinds of line segments for lines and polygon feature classes? Most often, users only need the default, which uses simple, straight-line segments. However, sometimes you might need curved segments, for example, to represent cul-de-sacs and roads. See Feature class basics.
- Define the coordinate system for each feature class. See An overview of map projections.
- Do you need to use this dataset at multiple scales? How will the representations change at each map scale? You may find that you¨ll need alternative feature class representations for use at other scale ranges. In these cases, you can consider additional feature classes for representing the same data theme for each scale range.
Sometimes, you¨ll load feature data as is into your GIS. If this is the case, you may not need to do any of the following additional design tasks. However, it is important to evaluate the advantages of adding further GIS capabilities to the features in your geodatabase. These additional capabilities can potentially make data use and maintenance much easier in the long term. They will help you maintain the integrity of your spatial information; will help in many ways for your data use; and, most important, will help you understand how much confidence you can place in your data to meet your needs.
Some common reasons for extending your simple features data model are as follows:
- If you need to validate a dataset before you import and use it in your system (for example, to ensure the dataset adheres to a series of spatial integrity rules)
- If you will need to edit the data and maintain its spatial integrity
- If you want to use the feature class for advanced GIS work such as modeling and analysis
Task 2. Organize related feature classes into feature datasets.
Use
feature datasets to organize spatially related feature classes into a common feature dataset. Feature datasets are necessary if you want to
A feature dataset is a collection of spatially or thematically related feature classes that share a common coordinate system. Feature datasets are used to hold feature classes that participate in a shared topology, a network dataset, a geometric network, or a terrain.
Sometimes users will organize a collection of feature classes for a common theme into a single feature dataset. For example, users might have a feature dataset for Water that contains Hydro Points (such as dams, bridges, and intakes), Hydro Lines (streams, canals, rivers), and Hydro Polygons (lakes, catchment areas, watersheds, etc.).
In some situations, people might use feature datasets as folders to hold a collection of simple feature classes. This technique is primarily used to organize how users share datasets. However, it is not a useful data structure for editing.
You will need to go through tasks 3 and 4 to decide on a final design for what feature classes should be organized within each feature dataset.
Feature datasets play a key role in establishing permissions for data editing. All the feature classes in a feature dataset will have the same permissions. This means that users can set permissions on feature datasets to identify which organization or group will maintain its contents. If different permissions need to be set on each feature class, then the feature classes should be organized in separate feature datasets (or feature classes), each with its own permission settings. In these cases, extract, transform, load (ETL) or Import/Export procedures can be used to move data updates between each dataset.
When to use feature datasets
Use feature datasets to spatially or thematically integrate related feature classes. Their primary purpose is for building a topology, a network dataset, a terrain dataset, or a geometric network.
You must use feature datasets to hold the set of feature classes that participate in any of the following geodatabase capabilities:
- Topology
- Network dataset
- Terrain
- Geometric network
- Cadastral fabric
Task 3. Add geodatabase elements to facilitate data editing and to manage data integrity.
The geodatabase includes some optional data modeling capabilities that add integrity rules and editing behavior to your GIS. These capabilities help you automate much of your data management work and integrity checks.
- Do you want to manage the integrity of attribute values? You can use domains, which are rules for assigning valid values in an attribute field.
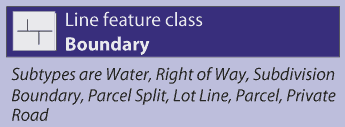
- Do you want to use subtypes to help manage subsets of features in a feature class? Subtypes allow you to set up special behaviors for each subclass. They can be used to set default rules for managing feature subsets. For example, you can use subtypes to automatically assign default attribute values as new features are added during editing, to set spatial integrity rules for how new features connect to others, and to add other feature behaviors.
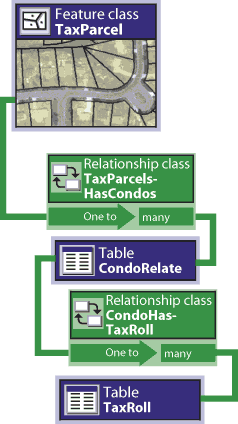
- Determine if there are related tables and if you need relationship classes. Relationship classes allow you to work with features in one table by selecting features in related tables, a very common relational database capability.
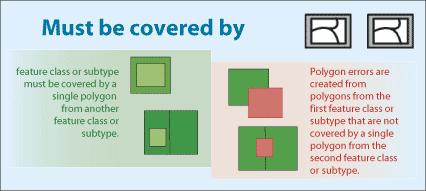
- Determine if there are spatial relationships between features in this feature class or with other feature classes that need to be modeled. For example, do you have parcels that share common boundaries? Do they share geometry with a feature class of parcel boundaries and another of parcel corners? Do you want to ensure that your road segments connect to one another or that electrical lines meet at junctions and switches? Do you have county boundaries that nest within states and do not overlap? Do you have vegetation classes that share boundaries with other environmental layers such as slope, aspect, and soil type polygons? In these kinds of cases, topology is very useful; in fact, it is essential.
The feature classes that participate in any topology must be organized into the same feature dataset. See topologies to read more about how you can use them within feature datasets to organize and manage the integrity of topological relationships during editing and update operations.
Task 4. Add capabilities for advanced data uses, analytic models (such as network analysis and geocoding), and advanced cartography.
With each dataset, you may want to consider adding additional geodatabase capabilities that help you further leverage each dataset. A number of alternative options are available, and you can apply any of these to add capabilities to your geodatabase.
- Do you want to model and use topological relationships to navigate through the nodes, edges, and faces of a topology? Will shared feature geometry help you more realistically model your features? For example, the polygon and line boundaries of numerous terrain data layers, such as feature classes for vegetation, slope, aspect, soil types, geology, water bodies, watersheds, ecological zones, and other environmental layers, nest within one another. Integrating their common boundaries using topology enables you to build much more robust and consistent attribute combinations. These greatly impact suitability/capability models and the ability to gain real insight into a problem. Topologies can also help you integrate features such as parcel systems, census units, administrative boundaries, and many other information sets. GIS users sometimes refer to this as vertical integration of GIS data layers.
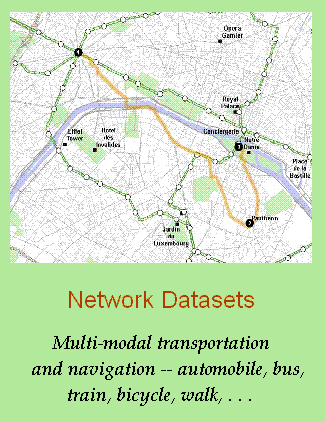
- Do you want to model a transportation network? The geodatabase uses a network dataset to model these situations. A network dataset is a collection of edges, turns, and junctions through which you can model navigation and the flow of goods and resources. Each network has a set of navigation properties. These include the "cost" to travel along each edge and transfer onto another edge as well as the ability to model one-way, left-turn, and other travel restrictions and multimodal networks (combining trips using an automobile, a bus, walking).
A network dataset uses feature classes as data sources for edges, junctions, and turns. You specify the role each feature class will play in the network along with its navigation properties. The feature classes that participate in a network must be organized into the same feature dataset.
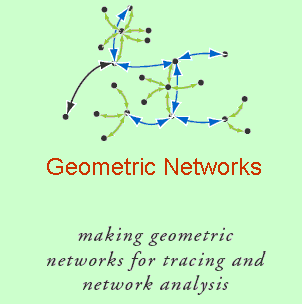
- Do you want to model utility networks? Electrical utilities and water, storm water, and sewer systems are modeled using a geometric network in the geodatabase. A geometric network is a set of connected edge and junction features used to model the flow of things such as electricity, water, gas, and storm water runoff. Each feature class is assigned a role in the geometric network as a collection of edges or junctions. The connectivity of the network is defined by feature properties and geometric coincidence. For example, valves (which are held as a point feature class) are connected to the endpoints of pipe segments (stored as line features). If the valve is open, water can flow through it in a specified direction.
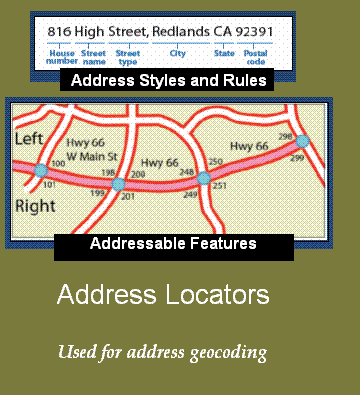
- Do you want to use geocoding? For address geocoding, you add an address locator
to your geodatabase. A locator is a combination of one of more feature classes containing addressable features (such as address range information for street centerlines) and a set of address styles and matching rules. Each locator dataset is used as the source for matching a single address or a large file of addresses to find address locations.
You can create locators and save copies of them independent of the geodatabase. This allows you to share your locators with many kinds of users for use in their own geocoding work.
- Do you want to use linear referencing to locate events or facilities along transportation lines? Linear feature vertices can also include m-values. Some GIS applications employ a linear measurement system used to interpolate distances along linear features, such as along roads, stream lines, and pipelines. You can assign an m-value to each vertex in a feature. One very common example is a highway milepost measurement system used by departments of transportation for recording pavement conditions, speed limits, accident locations, and other incidents along highways. Two commonly used units of measure include milepost distance from a set location, such as a county line, and distance from a reference marker.
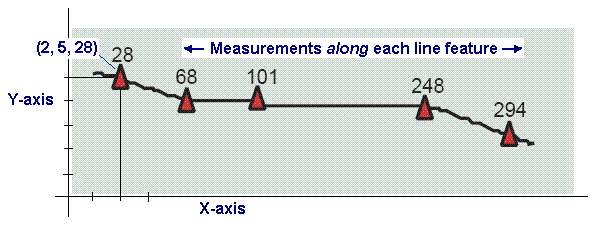
Vertices for measurements can be either (x,y,m) or (x,y,z,m).
Support for these data types is often referred to as . The process of geolocating events that occur along these measurement systems is referred to as .
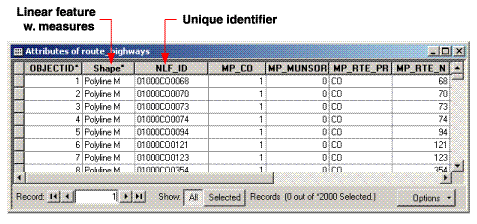
Measured coordinates form the building blocks for these systems. In the linear referencing implementation in ArcGIS, the term route refers to any linear feature, such as a city street, highway, river, or pipe, that has a unique identifier and a common measurement system along each linear feature. A collection of routes with a common measurement system can be built on a line feature class as follows:
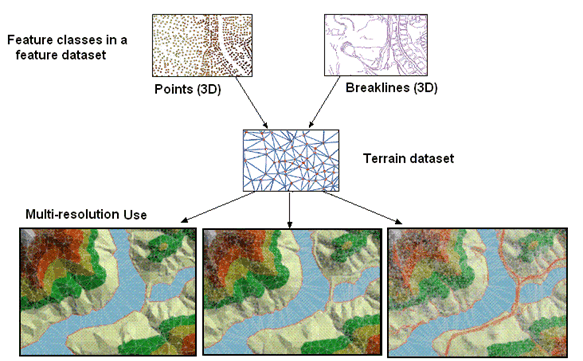
- Do you want to model elevation using triangulated irregular networks? Or do you need to manage lidar or bathymetric point collections? The geodatabase has a terrain dataset to model surfaces using triangulated networks and to manage large multipoint collections such as lidar and bathymetry data. Terrains are used to manage massive 3D point collections (such as billion-point lidar collections) as well as other 3D features and to generate multiresolution TINs from these collections.
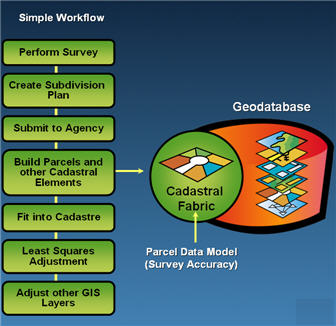
- Do you want to manage parcels or a cadastral database? A cadastral fabric is a dataset of connected parcels. In a cadastral fabric, parcels are represented by parcel line features, parcel point features, and parcel polygon features. Cadastral fabrics are created and managed using the ArcGIS Survey Analyst extension.
- Do you want to include cartographic representations and rules in your feature classes? A cartographic representation can be added to a feature class to hold drawing rules or alternative graphic representation for the map display of features. In GIS, most users automate mapping by defining a set of map layers. A map layer is a set of rules for how to symbolize and label features on each map. Sometimes layers are not enough to convey the information properly. For example, you might have street centerlines that connect at intersections. But, if you want to show bridges, overpasses, tunnels, and so forth, you cannot easily show these on your map.
A cartographic representation enables users to apply special overrides, rules, and graphics to ensure that the map representation is clear. For example, in a map display, road symbols exaggerate the size of roads and can cause conflicts with other features such as streams and buildings. With cartographic representations, you can offset some feature symbols to remove the conflicts—without having to change the underlying geographic location of the features. You can move the road representations off of the rivers and offset buildings from road symbols.
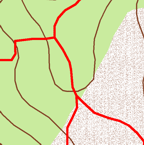
Feature geometry representing trail lines
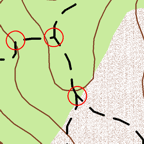
Using layers to represent trails as dashed lines
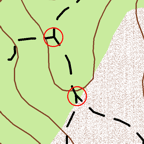
Using rules for starting all dashes with a half-dash for connectivity
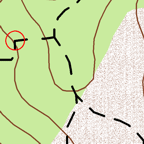
Using control points so that dashe travel through curves greater than a specified angle
Note:
This topic was updated for 9.3.1.
ArcGIS supports the use of CASE tools to import Unified Modeling Language (UML) models for geodatabase designs. However, support for all geographic data types, relationships, and behaviors is not complete in UML data modeling.
While UML is a useful tool for documenting the relational aspects of a geodatabase schema (such as table layouts and relationships), generally, it is not recommended to solely use UML for geodatabase design.
UML can be useful for relational database design (for example, for schemas that primarily contain feature classes, attribute tables, and a few other geodatabase properties). However, UML has generally not been useful for designing richer geographic behavior—topologies, networks, terrains, raster catalogs, map layers, map symbols, metadata, cartographic representations, semantic classifications, address locators, cadastral fabrics, linear referencing, and geoprocessing models. These data elements are used to define geographic behavior and associations.
Much of the richness of the geodatabase cannot be universally expressed in a UML design. More important, no special GIS insight is achieved through UML design. Graphing a hierarchy of object-oriented classes, subclasses, and inheritance in UML does not provide insight on how to model the spatial relationships in your geographic data; for example:
- How the parcel boundary lines connect to form closed parcel polygons
- How parcel corners, boundaries, and areas share coincident geometry with one another
- What integrity rules you expect to be maintained as part of their geographic representation in the system
Often, UML distracts designers from defining use cases that help you more clearly articulate critical geographic behaviors and spatial relationships.
Certainly, user communities can find some ways to express their geographic data elements as UML. In other words, you can
document many (but not all) design aspects of your geodatabase using UML.
Additionally, many relational modelers depend heavily on UML and want their GIS designs to interoperate with their other DBMS designs. In these cases, you can share parts of your geodatabase schemas using UML.
In addition, many people primarily want to use UML as a means to share their schema and rules. ArcGIS has other mechanisms that can support schema documentation and sharing, such as via geodatabase XML.
Bottom line: UML is one of a number of methodologies (such as entity-relationship modeling) that can be used effectively for relational and tabular modeling. However, the use of UML alone is not sufficient. UML is not a replacement for the necessary work of geographic data modeling required in GIS—defining spatial behaviors and use cases of the spatial relationships you want your geodatabase to convey. The design steps described earlier in this Design section of the help (See
Geodatabase design steps) will provide guidance on these other aspects of geodatabase design.
A useful tool for documenting your schema using graphic representations that ESRI uses is described in
Using the geodatabase diagrammer tool.
Note:
This topic was updated for 9.3.1.
Geodatabase data models are designed to be used in practical application scenarios by a wide range of users. To ensure that each design is easy to understand and implement, each data model was built to support easy migration from existing data structures and has been designed to be flexible, extensible, and easily adapted by your organization. Here are a few final design tips to help you with your design implementations.
-
Build on your existing GIS designs.
Most existing database designs are suitable for moving forward. You can build on what has worked in the past and find new geodatabase capabilities that will improve on your past efforts.
-
Use generic geodatabase types whenever feasible.
Combining generic data structures with very rich GIS tools provides the best solutions that will scale and support multiple users and applications. Leverage the ArcGIS software logic as much as possible for your work. Only use customized GIS data structures as a last resort.
-
Integrate related feature classes using topology.
Legacy ArcInfo users with coverages will find many opportunities to integrate feature classes using topologies in the geodatabase. Learn how to use geodatabase topology and its rules. This will create real savings during editing, minimize the amount of customization work you¨ll need, and increase user productivity. Even small GIS organizations will see 40 percent increases in efficiency for data maintenance.
-
Combine GIS design concepts from this section with traditional relational database design methods.
Both database management system (DBMS) and GIS design methodologies are critical for good GIS design. One is not sufficient without the other. Learn to use and apply both sets of techniques.
-
Prototype and pilot your geodatabase design.
Prototyping a design using file, personal, or ArcSDE personal geodatabases with ArcGIS Desktop is easy, fun, and effective. You’ll be surprised at how much insight you’ll gain through experimentation and how much more effective and efficient your design process will become.
During the final stage of design, you’ll want to test scalability and workflows that represent the work that your organization will perform with your geodatabase. Use this to make final adjustments to your design. Be practical in your final test phase and adjust your design as necessary.
 Print Topics


