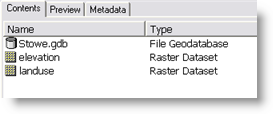
Data
You can find the data for this example in C:/arcgis/ArcTutor/Spatial. The data is for the town of Stowe, Vermont. The contents of C:/arcgis/ArcTutor/Spatial is illustrated below.
Create a toolshare folder
- Start ArcCatalog.
- In a location of your choice, create a new folder named Watershed. Within Watershed, create a ToolData and Scratch folder. Within Scratch, create a new file geodatabase named Scratch.
- Copy the contents of the c:/arcgis/ArcTutor/Spatial folder into Tooldata.
Data Processing
For this service, you'll need to create four new raster datasets, as shown below.
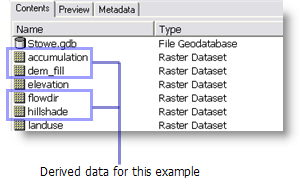
- dem_fill is the result of executing the Fill tool using elevation as input.
- hillshade is the result of executing the Hillshade tool using dem_fill as input.
- flowdir is the result of executing the Flow Direction tool using dem_fill as input.
- accumulation is the result of executing the Flow Accumulation tool using flowdir as input.
The model in this example uses a feature set, and you will need a point feature class to use as the feature set schema. In Stowe.gdb, create a new point feature class named PourPoint.
- For a coordinate system, import any of the existing datasets within the Tooldata folder.
- Use the default values for XY tolerance and configuration keyword.
- PourPoint needs one additional field, WatershedID, a long integer.
Basemap
The basemap contains three layers: Landuse (landuse raster), Hillshade (hillshade raster), and Roads (Stowe.gdb/roads feature class), as illustrated below. You will need to create a map document containing these layers. The ArcMap document is named StoweBasemap.mxd.
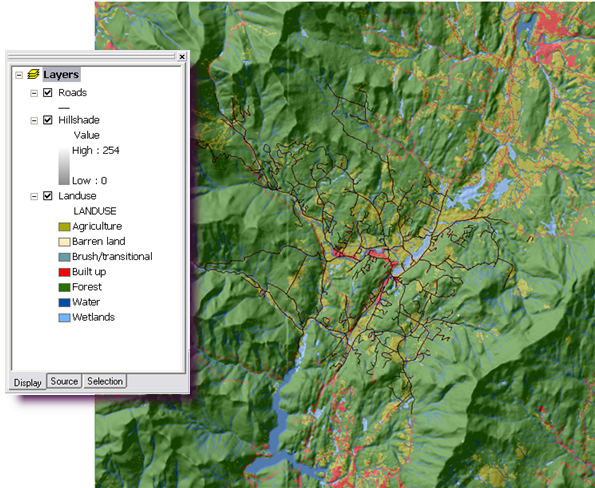
The Hillshade layer is drawn with a transparency of 55 percent. To change transparency, right-click the Hillshade layer, choose Properties, click the Display tab, and change the transparency.
After creating and saving StoweBasemap.mxd, publish it as a map service to your server.
- In ArcCatalog, right-click StoweBasemap and click Publish to ArcGIS Server.
- In the first panel, name the service StoweBasemap (the default).
- Click Next.
- The only capability that you need is Mapping—all other capabilities are optional and for this service.
- Click Next.
- Click Finish.
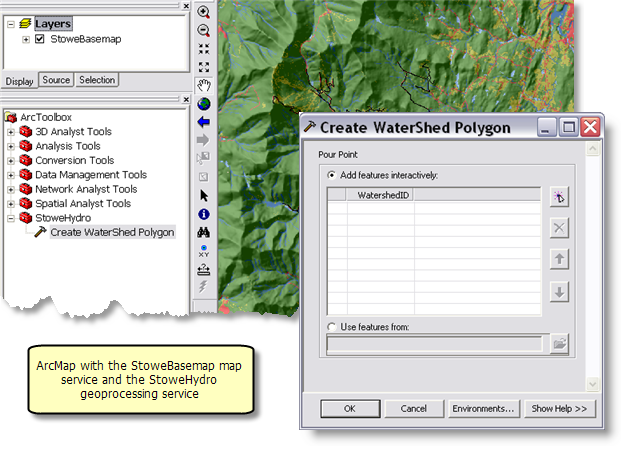
You can test the StoweBasemap service by starting ArcMap with a blank document, then add the service by clicking Add Data

, navigating to the server, and choosing StoweBasemap.
Toolbox and map document
- In the Stowe folder, create a new toolbox with the name StoweHydro.
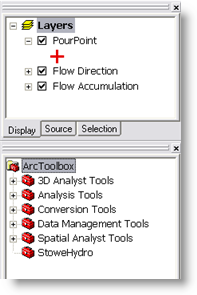
- Start ArcMap with a new document and add the accumulation and flowdir rasters to the table of contents, renaming the layers to Flow Accumulation and Flow Direction. Add the PourPoint feature class you created above.
- Optionally, change the symbology of PourPoint to a red plus sign, as illustrated below.
- Show the ArcToolbox window
 .
.
- Add the StoweHydro toolbox to the ArcToolbox window.
The table of contents and the ArcToolbox window should appear similar to the following illustration. The Flow Direction and Flow Accumulation layers will be used in the published task, but never displayed to the user. Therefore, the symbology of these layers does not matter.
Set the geoprocessing scratch workspace environment to the Scratch folder, as follows:
- Right-click the ArcToolbox entry and click Environments.
- Expand the General Settings category.
- Enter the pathname to the Scratch folder (for example, E:\Watershed\Scratch).
Save the map as StoweHydro.mxd.
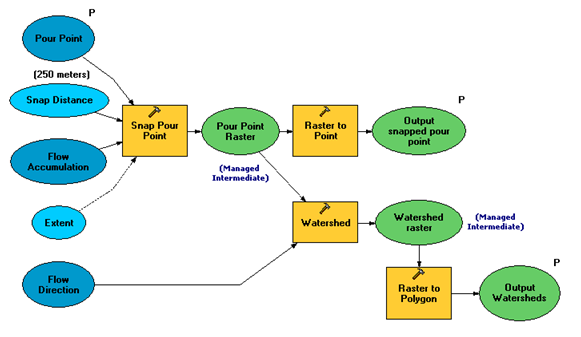
The input to the Create Watershed Polygon model a user-supplied point and a WatershedID for the point. A watershed polygon is output for each input point. In addition, the user-supplied points will be snapped to the cells of highest flow accumulation using the
Snap Pour Point tool. The snapped points will also be output.
Since these models make use of layers in the map document, you create these models in ArcMap using the StoweHydro map document.
The Create Watershed Polygon model is illustrated below.
Steps to building the model
- Right-click StoweHydro in ArcToolbox and choose New > Model.
- Create a variable with the Feature Set data type, as follows:
- Right-click in the ModelBuilder canvas and click Create Variable.
- Choose Feature Set as the data type.
- Click OK.
- Change the variable name to Pour Point.
- Right-click Pour Point and click Properties. Click the Data Type tab. Set the schema to the PourPoint layer by choosing it in the drop-down list.
- Right-click Pour Point and click Model Parameter. A check should appear next to Model Parameter, and a P will appear next to the Pour Point variable.
- Add the Snap Pour Point tool.
- Right-click Snap Pour Point and make a variable from the Snap Distance parameter.
- Double-click Snap Distance and set the Snap Distance to 250 meters. It is not a requirement that you make Snap Distance a model variable, but doing so gives anyone who views the model a visual clue that snap distance is an important variable.
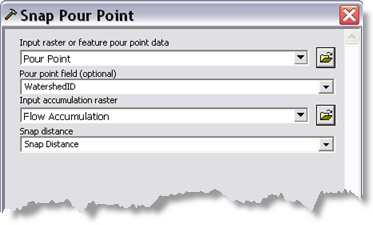
- Double-click Snap Pour Point and set the input parameter Pour Point. Set the Pour point field parameter to WatershedID. Set the Input accumulation raster parameter to the Flow Accumulation layer. These settings are illustrated below.
- Right-click Snap Pour Point and click Make Variable > From Environment > General Settings > Extent, as illustrated below.
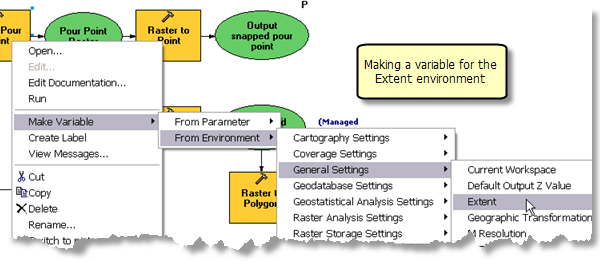
- Double-click the Extent variable and set it to Union of Inputs.
- Change the name of the output of Snap Pour Point to Pour Point Raster. This is intermediate output and will be deleted after the model executes. Right-click Pour Point Raster and click Managed. A checkmark should appear next to Managed.
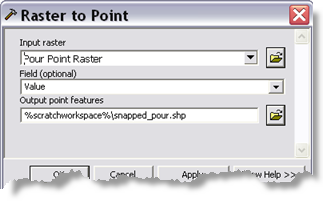
- Add the Raster to Point tool. Double-click Raster to Point and set the Input raster parameter to Pour Point Raster. Set the Output point features parameter to %scratchworkspace%\snapped_pour.shp.
- Rename the Raster to Point output variable to Output snapped pour point.
- Right-click Output snapped pour point and make it a model parameter.
- Add the Watershed tool and use the Flow Direction layer for the Input flow direction raster parameter. Change the name of the output of Watershed to Watershed raster.
- Watershed raster is intermediate output. Right-click Watershed raster and click Managed. A checkmark should appear next to Managed.
- Add the Raster to Polygon tool. Set the Input raster parameter to Watershed raster. Set the Output Polygon features parameter to %scratchworkspace%\Watershed.shp.
- Change the name of the output variable of Raster to Polygon to Output Watershed.
- Right-click Output Watershed and make it a model parameter.
- In the main ModelBuilder menu, click Model, then click Model Properties.
- Set the Name to CreateWatershedPolygon.
- Set the Label to Create Watershed Polygon.
- Check Store Relative pathnames.
- Save and close the model.
Creating symbology layer files
In this next series of steps, you will be creating layer files to use as output symbology for your task.
- In the ArcToolbox window, double-click the Create Watershed Polygon tool to open its dialog. The dialog should appear as illustrated below.
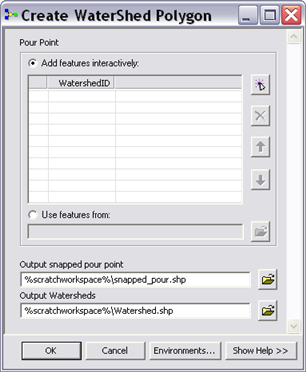 (The order of the parameters in your tool dialog may be different, depending on the order in which you made variables model parameters. You can change the order of parameters in the tool's properties.)
- Click Add feature
 to add a pour point. The location you use for the Pour Point should be in a valley, not on a mountaintop where there is no watershed.
Learn more about using the feature set control to add features.
- Click the WatershedID cell and enter an integer value.
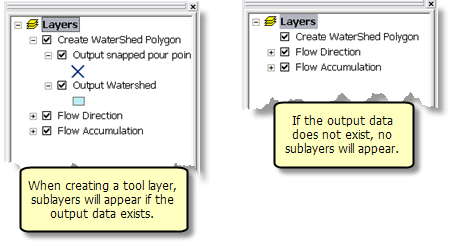
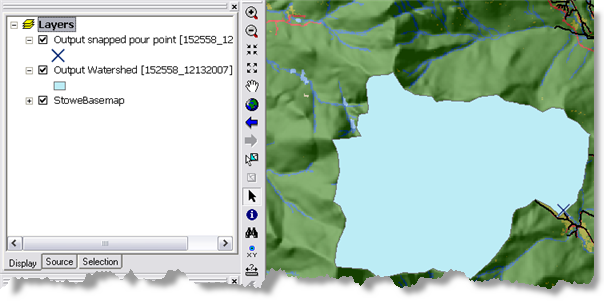
The illustration below shows a result of executing Create Watershed Polygon.
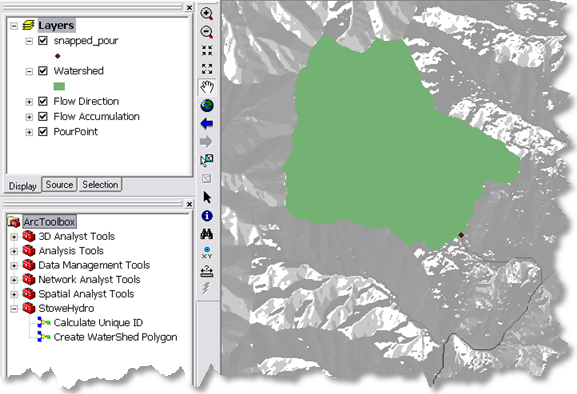
In the above illustration, note that the output watershed polygon is green and the snapped pour point is a small dot. (Your symbology may be different.) In the following steps, you will create better symbology. Save this symbology as a layer file (.lyr), then use these layer files to define the symbology of your output variables.
- Open the properties for the snapped_pour layer and set the symbol to a dark blue x.
- Open the properties for the Watershed layer and set the fill symbol to a light blue.
- Right-click snapped_pour, click Save As Layer File, and save to Stowe\ToolData\snapped_pour.lyr.
- Right-click Watershed, click Save As Layer File, and save to Stowe\Tooldata\Watershed.lyr.
- Edit the Create Watershed Polygon model.
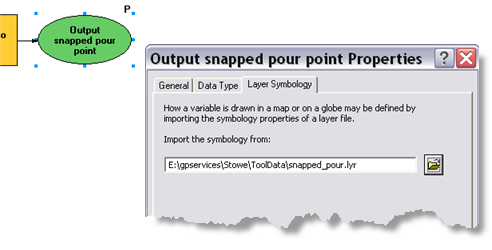
- Right-click the Output snapped pour point variable and click Properties. In the Properties dialog box, click the Layer Symbology tab and set the symbology layer to snapped_pour.lyr, as illustrated below.
- Do the same for the Output Watershed variable, setting the symbology layer to watershed.lyr.
- Save and close the model.
- Remove the existing snapped_pour and Watershed layer from the table of contents.
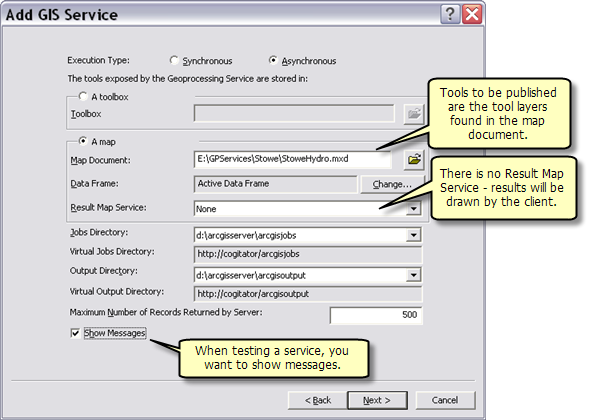
In
previous steps, you published the StoweBasemap map service. Now you will publish the StoweHydro geoprocessing service. The StoweHydro service contains the Create Watershed Polygon task.
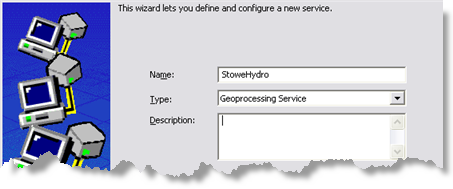
- In ArcCatalog, navigate to your server, right-click and choose Add New Service. Name the service StoweHydro and choose Geoprocessing Service as the type, as illustrated below.
- Click Next.
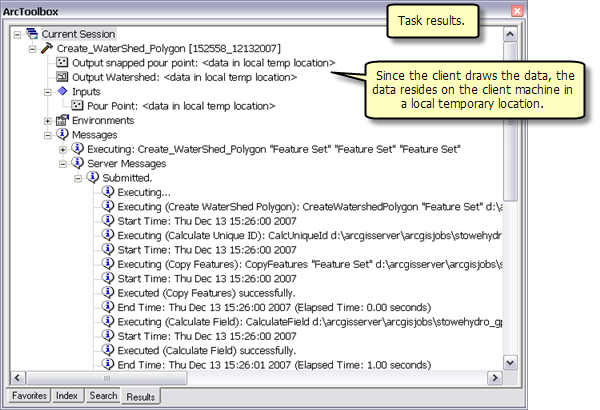
- In the next panel, you choose StoweHydro.mxd as the source for your geoprocessing service, as illustrated below. Since you will test your service, check Show Messages.
- Click Next. From this point on, you can accept the default values provided by the wizard.