 Feedback
 E-mail this topic
 Print this topic
| Select symbols |
Feedback
E-mail this topic
Print this topic
|
In some cases, you’ll decide how the GIS information that you add to the map should be displayed, whether it’s to assign a symbol to a place that you find, or to specify how the features in a shapefile should be drawn.
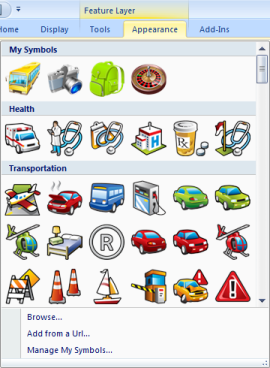
When you add content to the map (i.e. create a note, add a shapefile, etc), the application assigns a default symbol for you to display the data. You can change the symbol used by clicking the item’s Appearance tab.
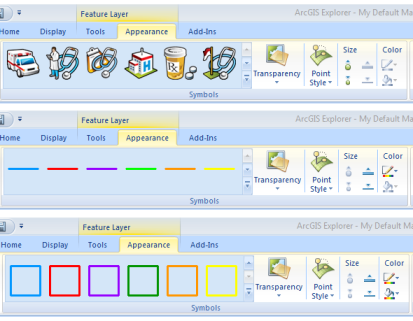
The Appearance tab includes a Symbol group that contains various controls for selecting symbols to draw the GIS data with and controls for modifying properties of the symbol. Notice the different galleries for points, line, and areas (polygons):
Transparency: clicking the transparency control displays a slider control that allows you to change how transparent the symbol displaying the data is. The more transparent, the more you can see the map content that is drawn under the symbolized data. The transparency control is available for all geometry types in feature layers: point, lines, and polygons:
![]()
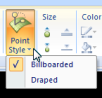
Point Style: the point style menu gives you the option of displaying the point symbol as a billboarded 3D symbol when the map is in 3D displaymode, or as a rasterized symbol draped on the surface of the map:
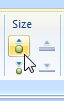
Size: when you add points to a map, a symbol size is assigned for you based on the scale ranges the data is displayed in, what the data represents (that is, a map note versus a GIS feature), etc. In ArcGIS Explorer this point size is represented in terms of pixels or a point to map units conversion. In most cases, you just want to adjust the symbol to be a little larger or smaller. Two controls, one to increase, the other to decrease the point size, are available in the Appearance tab's Symbol group:
A similar pair of controls is available for changing the width of lines or the outlines of fill symbols:

Line Color: you can change the color of a line symbol or the outline of a polygon symbol by clicking the Line Color control to display a selection of standard palette of colors and variations on those colors that you can pick from.
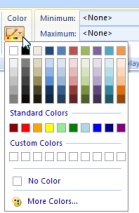
You can choose to have no color for the line or outline by clicking No Color.
Fill Color: you can change the color of a fill symbol by clicking the Fill Color control. This will display the same color selection control as described above for Line Color.