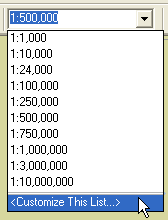
Click <Customize this list>
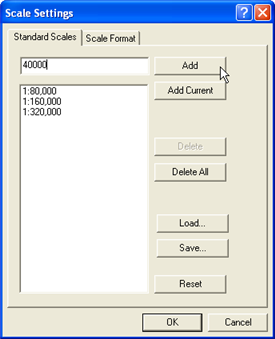
Type one of your scales in the box and click Add. Keep doing this until you’ve added all of your scales. Then click OK.
The best way to create fast map services is to cache them. When you cache a map service, the server draws the map at a set of scale levels that you define and then saves the images. When the server receives a request for map, it’s much quicker to return one of these cached images than to draw the map again.
Caching is appropriate for base maps and maps that don’t change often. For maps that change only occasionally, tools are available to update the cache. To achieve optimal performance, you should cache as many layers as you can. You may find it helpful to make two maps and separate the layers that are appropriate for caching, such as base map layers, from layers that would not be feasible to cache, such as layers that get updated in real-time or layers that change as a result of analysis or modeling.
Creating an effective map cache requires you to do some careful design and authoring work before you build the cache. This tutorial walks you through the process of planning and authoring a map that will be cached. You’ll then create a map service and cache it. Finally, you’ll test the cache in several client applications.
When working on this tutorial, select some simple datasets that cover a fairly small area, such as a city or county. This tutorial is meant as a practice so that you can prepare for future caching jobs within your organization. Pay close attention to the discussion and instructions, but don’t worry about getting it perfect the first time. Designing good caches takes some practice.
This tutorial has four main sections:
When you cache a map, the server draws it at a set of scales that you select. Once the map is drawn, you can’t change the way it looks unless you re-create or update the cache. This means two important things:
Your organization may have already determined a tiling scheme to use when caching. A tiling scheme determines certain properties of your cache, including which scale levels to create.
In this tutorial, we’ll assume that you are creating your own tiling scheme and you need to pick out some scales. To get started determining appropriate scales for your map, follow the steps below:
Note: It’s not required that you divide the scale by two; you could use other numbers. But in most cases, dividing by two provides a good magnitude of "zoom".
Now that you’ve chosen some scales, you can start making the map look good at each one. As you author the map, you may often need to move back and forth between these scales. To make this easier, you can enter the scales into the dropdown list in ArcMap:
Click <Customize this list>
Type one of your scales in the box and click Add. Keep doing this until you’ve added all of your scales. Then click OK.
Now it’s time to do the real map design work. One benefit of caching your map is that during the design phase, you can use all of the cartographic tools at your disposal without worrying about how they will affect performance. Take some time to make your map look nice, because once the cache is created you will not be able to make changes without re-creating or updating the cache. Users of the cache won’t be able to change the symbology either, since they’re just viewing pre-existing images of the map that are stored on the server.
A good practice is to design your map at each scale you’ve chosen for your cache. This is easier for raster data because ArcMap does some resampling of the data as you change scales. Vector data, however, will be symbolized with the same size points and lines at each scale, and requires a little more effort to keep the map from looking too cluttered or too sparse. The steps below describe a design strategy you can use if your map contains vector data.
Set the symbology and labeling of your layers for this scale.
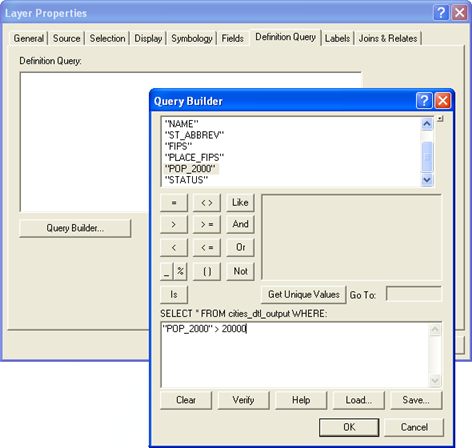
Tip: You may want to set a definition query so that fewer features are visible at this scale. For example, if you have a cities layer, you may set a definition query that limits display to cities with a population greater than 20,000.
Set the symbology and labeling of your layers for this scale.
Tip: If you want to change the symbology, labeling, or definition query on a layer that you already symbolized at a different scale, add another copy of the layer to the map. To do this, right-click the layer in the ArcMap table of contents and click Copy. Then right-click the data frame name and click Paste Layer(s).
If you wind up with many copies of a layer, you can use a group layer to keep track of them. Enter names for the group layer that are easy to remember. You might even include the scale in the name. For example, you might have this group layer hierarchy:
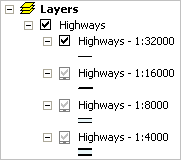
You need to set a scale range on each layer so that only one is visible at each cached scale. Configure the scale range with a tolerance around each cache scale. For example, with the roads layer pictured above that will be cached at 1:8000, you might set the layer to be visible only when zoomed in beyond 1:10000 and zoomed out beyond 1:6000.
In order to create the cache, you must first publish your map as a service. You can use either ArcGIS Server Manager or ArcCatalog to do this. These instructions will use ArcCatalog, since you’ll be using ArcCatalog anyway to create the cache. Caching is only available in ArcCatalog.
In both Manager and ArcCatalog there are two ways to create a service. The Publish GIS Resource option prompts you for the minimum amount of information needed to get the service up and running. It sets default values for all of the other service properties. In contrast, the Add New Service option allows you to set advanced properties before you publish the service. These instructions show how to use the Add New Service option so that you can increase the default number of running instances. This higher number of instances will be able to use greater processor resources when you create the cache.
Now you’re at the panel of the wizard where you can choose the pooling model and number of instances for the service. For cached services, you should always select the default of Pooled. You may, however, want to raise or lower the Maximum number of instances to something greater than 2.
In most cases, a CPU can handle at least 3 instances while caching. More powerful machines, or configurations with multiple SOC machines, can handle even more instances. If you want to use all of your server power in creating the cache, or if you have a very large ArcGIS Server deployment, you should raise the default maximum number of instances.
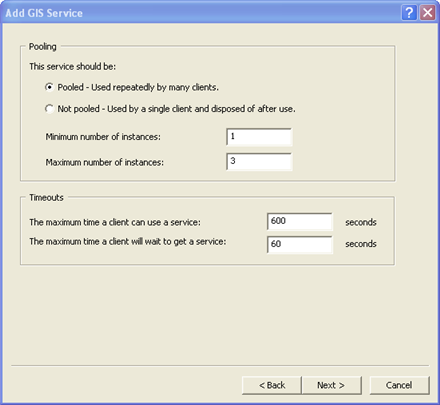
Tip: You may wonder if you need to set the timeout value to something greater than the default, since creating the cache can take a long time. Actually, the caching tools reset the timeout value to be very large before they start creating tiles, so you do not need to change the default timeout value here.
Now that you have a running map service, you can create the cache. To get the caching started, follow these steps:
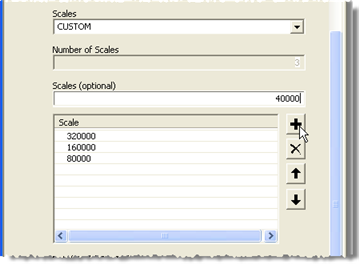
In the Scales (optional) box, type one of your scales. Then click the Add (+) button. You should see the scale appear in the list below.
Note: The tool does not accept values that use fractions or colons, so instead of typing the scale you actually need to enter the scale factor. For example, if the scale is 1:80000, enter 80000.
Continue entering scales and clicking the Add (+) button for each one until you have reached the end of your list.
Change the Cache Tile Format to JPEG. This format produces small tiles and will reduce the disk space needed to store the cache. Clients can also load the tiles quicker.
Note: This step assumes that you are not going to overlay this cache on another service. For overlay services such as road and boundary networks, you should select PNG8 instead.
Optionally, change the Number of MapServer Instances. This number is a measure of the server computing power you want to dedicate toward creating your cache.
If you want to dedicate all of your resources to creating the cache, set a high number here. You can only set a number up to the Maximum number of instances property you set on the map service (see above instructions for Publishing the map service).
If you only have one ArcGIS Server machine that needs to fill other requests while creating the cache, you might want to keep or decrease the default number of instances. This will ensure that the caching job does not consume all of your server resources. Just remember that the fewer the number of instances you dedicate toward cache generation, the longer it will take to create the cache.
The cache can take a while to generate, depending on your largest scale, the extent of your data, and other factors. If you picked some simple datasets with a small geographic extent for this exercise, the cache will probably be completed in less than an hour. More likely, it will only take a few minutes.
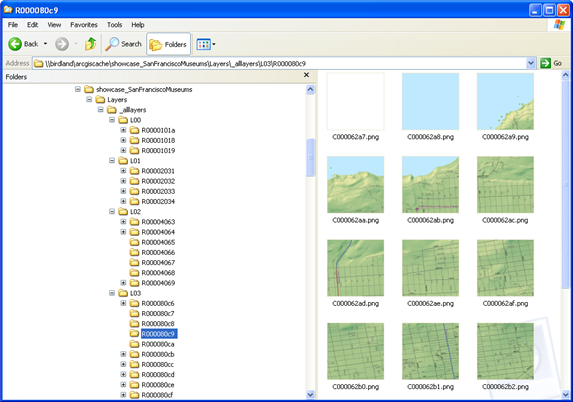
You can use Windows Explorer to get a rough view of the progress of the cache generation.
Go back up to the _alllayers folder and examine the folders prefixed with L (L00, L01, etc.). These folders represent the different scale levels in your cache. The timestamp on the folder tells you when it was generated. Each successive scale level takes longer to generate because it contains more tiles. In our case, where we doubled the scale, each scale level contains four times as many tiles as the previous level.
Once the cache is finished, you can test it in a Web Mapping Application to make sure that the map appears and performs the way you expect. This is also a good way to verify that the tiles are being recognized and used successfully by the application.
The Web application you use for testing can be a simple one. A good way to create the test application is to use ArcGIS Server Manager.
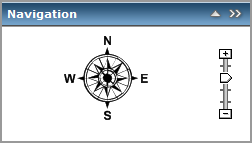
The completed Web application will appear in a new window. Expand the Navigation panel. If the Zoom Level slider control appears, the application is successfully using your cache.
If it doesn’t appear that the application is using the cache, make sure that:
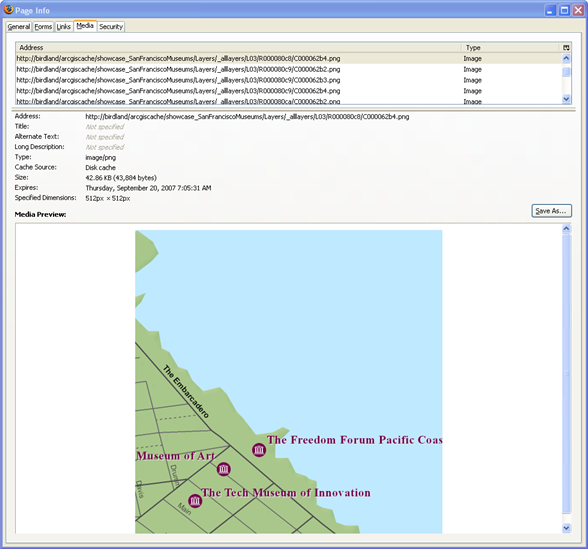
If you’re using Mozilla Firefox to view your Web application, there’s an easy way to tell if your cache tiles are being used.
Examine the images that appear in the list. If you see images from your server cache directory (or its associated virtual directory), you know your cache is being used.