Tutorial: Publishing a geoprocessing service


Tutorial: Publishing a geoprocessing service |
|
| Release 9.3.1 |
|
With ArcGIS Server, you can publish geoprocessing services that allow you to submit jobs to the server and get back a set of results. The server accesses the model and does the work, freeing your computer's resources and eliminating the problem of sharing copies of the model.
Many ArcGIS applications can use geoprocessing services, including ArcMap, ArcGIS Explorer, and Web mapping applications that you create with ArcGIS Server. This tutorial focuses on building a geoprocessing service for use within a Web mapping application. If you're interested in building a geoprocessing service that will be mainly used in ArcMap, see the various Geoprocessing service examples.
Before getting started with creating a geoprocessing service, you should know the following:
Building a geoprocessing service requires that you first create a model using the ModelBuilder feature in ArcGIS Desktop. A model is a logical sequence of geoprocessing tools and scripts that help you automate a GIS operation. A model contains tools from ArcToolbox and, optionally, scripts that you've written to help automate your work. You can't publish individual tools or scripts as geoprocessing services; you can only publish models. It's possible, however, to publish a model that contains only one tool or script.
If you haven't previously worked with models in ArcGIS, or you need a review, a good place to start is An Overview of Models in the ArcGIS Desktop Help.
Geoprocessing services support a limited set of input and output data types. For your model to run correctly on the server, you need to verify that all the input and output data types used by your model are supported. There are different strategies for modifying your model so that it uses only supported input and output data types. You can find these strategies, along with a list of all supported data types, in the topic Key concepts for geoprocessing services.
When you install ArcGIS Server, a directory is created for working with geoprocessing services. This is the server jobs directory, and by default, it's located at c:\arcgisserver\arcgisjobs. When you use a geoprocessing service, intermediate and output data from the model are stored in the server jobs directory. Each execution of the model, or job, has its own unique folder in the server jobs directory. This allows different people to use the service at the same time without the results getting confused.
Because the server jobs directory takes care of managing your intermediate and output data, you don't have to worry about setting the scratch and current workspaces in the model environment.
This example walks you through the process of building a simple model, publishing it as a geoprocessing service, and running the service in a Web mapping application. The steps include tips and best practices for working with geoprocessing services.
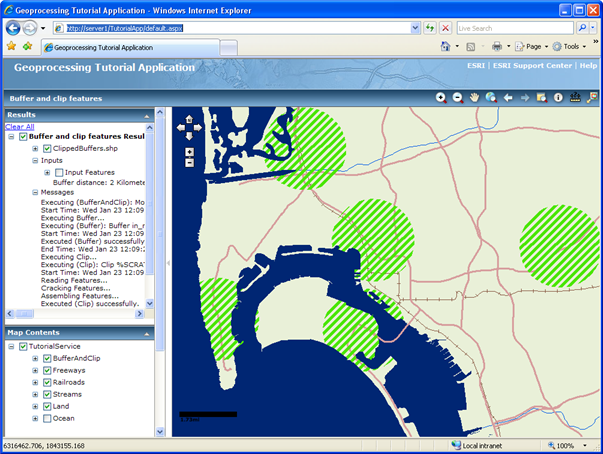
The model you'll create in this example uses two tools: Buffer and Clip. When you run the model, you'll interactively define a set of points on the map along with a buffer distance. When the model runs, it will buffer the points at the specified distance. To exclude areas in the ocean, the model will then clip the resulting buffers to the shape of a feature class representing the coastline.
To build this model, you can use any data of your own, preferably with a feature class representing a boundary or coastline that you can clip to. The illustrations in this example use some data of the San Diego, California area. The model will clip to the feature class Land.
This model also requires that you've previously saved a point layer file somewhere on disk, containing the symbology you want to use for your input points.
Follow these steps to build the model:
Create a new toolbox by right-clicking ArcToolbox and choosing New Toolbox. You can name this toolbox GeoprocessingTutorial.
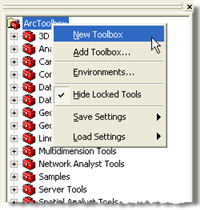
Tip: Where did this toolbox get created in the file system? By default, it's added to your user profile. The path is probably similar to C:\Documents and Settings\myUserName\Application Data\ESRI\ArcToolbox\My Toolboxes\GeoprocessingTutorial.tbx. This is important to know because when you publish the toolbox as a service, you must make sure the ArcGIS Server Object Container (SOC) account has permissions to access this file.
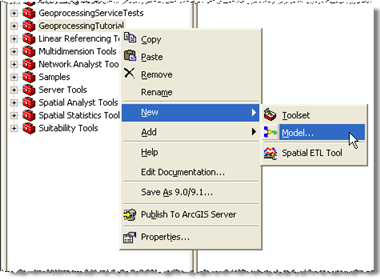
Create a new model by right-clicking the toolbox and clicking New > Model. By default, the name is simply Model. You can change this later.
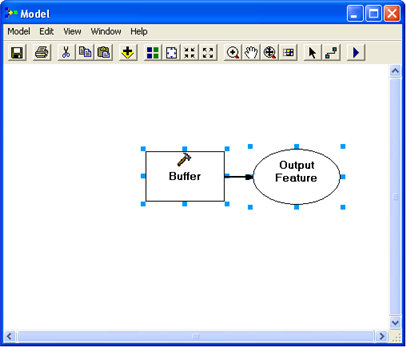
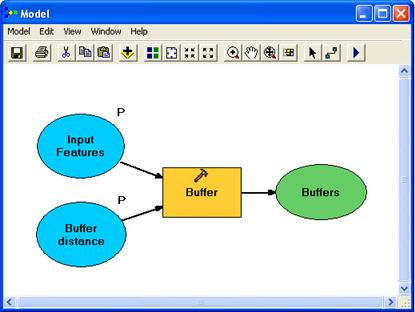
When you create a new model, the ModelBuilder window opens. At this point, you can start adding the tools that you want in the model. Begin by finding the Buffer tool in the Analysis Tools > Proximity toolset. Drag the Buffer tool from the toolbox into the ModelBuilder window.
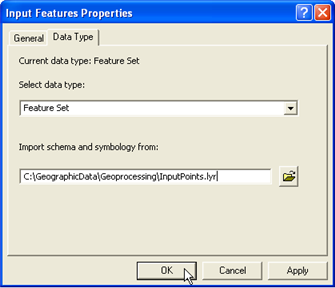
Right-click the Input Features oval, click Properties, then click the Data Type tab. Note that the data type is set to Feature Layer by default. Remember that geoprocessing services cannot take all data types as inputs; Feature Layer is not a supported input type, but Feature Set is. Change the value in the drop-down list to Feature Set. Additionally, while you are looking at this tab, browse to any point layer file to designate the symbology you want to use for your input points.
To make the model easier to read, rename "Distance [value or field]" to "Buffer distance" and rename your output features (probably now "Buffer.shp") to "Buffers". To rename these model components, right-click them and click Rename.
You may need to drag around the model components to see everything. Your model should look similar to the one below:
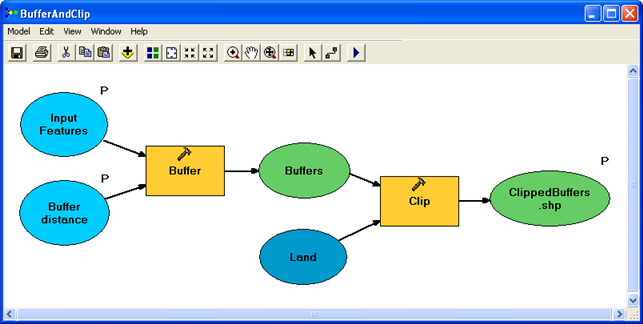
Now add the second tool to the model. Click Analysis
Tools > Extract toolset, then find the Clip tool and drag it onto the
right side of the model. Use the Add Connection button  to connect Buffers to the Clip tool.
Important: There are two Clip tools in ArcToolbox. Make sure you use the one in Analysis Tools, not in Data Management Tools.
Tip: Switch back to the Select tool  immediately
after performing this step.
immediately
after performing this step.
Double-click the Clip tool and set the Clip Features to be the boundaries or coastline feature class that you want to clip to. This example uses the Land feature class to eliminate buffer areas that are in the ocean.
Tip: Remember where the clip features are located. When you publish the geoprocessing service, you must make sure the SOC account has access to this location.
You've completed the model! It should look similar to the one below. Save your model and close the ModelBuilder window.
Now that you've created the model, you can take the next steps to get its functionality into a Web application. At this point, you need to put some thought into what will happen in the Web application. The Web application can draw the model results in two ways: it can send the results data to the client to be drawn there, or it can draw the results on the server and send the completed image to the client.
If you decide that the client machine should draw the results, you don't need to make any additional preparations in ArcGIS Desktop; you only need to publish the toolbox as a geoprocessing service. There is, however, a limitation when drawing the results directly on the client: only symbology from the Web Application Developer Framework (ADF) graphics layer can be used. Available symbology includes simple marker, line, and fill symbols, as well as a few other symbol types listed in Defining output symbology for geoprocessing tasks. Cartographic line symbols, as well as gradient fill symbols and other types of complex symbologies, require that the results be drawn on the server.
If the results are drawn on the server, they can use a much greater variety of symbols. This is because the geoprocessing service works with an associated map service that can do the rendering necessary for all the symbols. Additional advantages to drawing the results on the server include the ability to use layers in the map service as input to the model, and the ability to work with large numbers of features in the results (if you tried to send a lot of features to be drawn on the client, it might take a long time or might not be permitted by the server administrator).
This example shows how to draw the results on the server, which requires you to create an associated map service. You need to create a map that can be used to visualize the inputs and results of the model. Once you've created the map, you need to add your model to the map as a tool layer. The following steps explain this process:
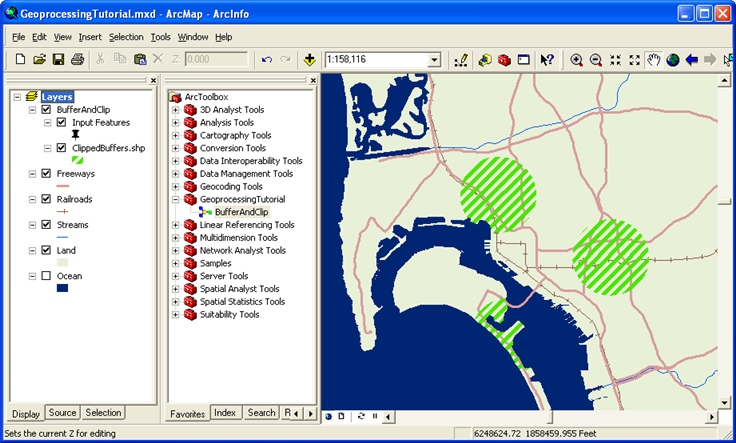
Now create the tool layer. Do this by dragging the BufferAndClip model from ArcToolbox into the table of contents with the rest of the layers.
Remember: Having a tool layer in your map is the key to getting a geoprocessing service that will work with your map service.
The input features for the model are already symbolized according to the schema you imported in step 7 above. Now, use the layer properties to set the symbology that you want for the output features.
Remember: In this example, the output features are symbolized with an angled line fill symbol as shown below. This symbology is only possible when the server draws the results using an associated map service; it would not be available if you attempted to draw the results on the client.
Once you have a map document with a tool layer, you're ready to publish these as services. You'll publish the map document as a service and enable the Geoprocessing capability, which will create a geoprocessing service of the same name. You can use these two services within your Web application to run the model on the server and display the results.
Important: Before publishing your services, be sure to read and follow the guidelines presented in Preparing resources for publishing as services. These will help you ensure that the server has permissions to read and access all the data for your model and your map. Specifically, the SOC account needs to have read permissions to your model (toolbox), any data referenced by the model (such as the clip features), the map document, and any data in the map document. The SOC account also needs read and write access to the server jobs directory. If you're using the default server jobs directory installed with ArcGIS Server (C:\arcgisserver\arcgisjobs), then the installation process already applied the appropriate permissions for the jobs directory.
Follow these steps to publish the services:
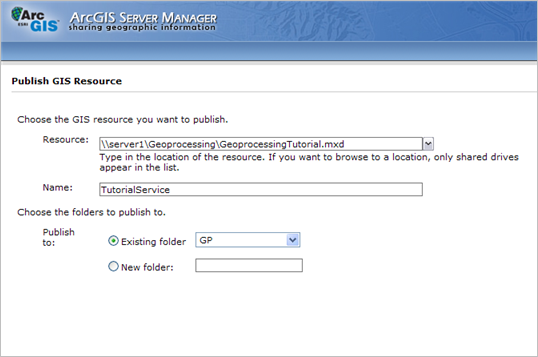
Log in to ArcGIS Server Manager and click Publish a map, globe, or other GIS resource as a service.
Tip: There are two wizards in Manager that you can use to publish services. This link takes you to the Publish GIS Resource wizard, which is the simplest way to create a service. It asks you the minimum amount of information needed to create a service. Another feature of the Publish GIS Resource wizard is that you can use it to create associated services, like the geoprocessing and map services that you're going to create in this example.
The other way to create services is the Add New Service wizard. This wizard is the completely manual way of publishing a service; it prompts you for all the service parameters. You cannot use the Add New Service wizard to automatically create associated services.
Give your service a name. The name you enter here will be used for both the map service and the geoprocessing service. Optionally, if you have your services grouped in folders, choose the appropriate folder, then click Next to move to the next page of the wizard.
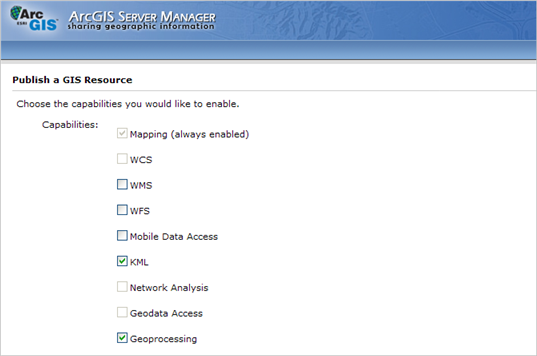
On the second page, notice that two capabilities are enabled by default. Mapping is enabled for all map services. Geoprocessing is enabled because Manager detected that the map you're publishing has a tool layer. Publishing a map service with the Geoprocessing capability enabled creates an associated geoprocessing service with the same name. Leave these capabilities checked and click Next to move to the final wizard page.
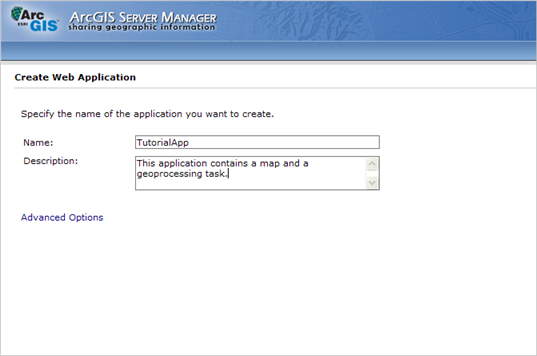
The final step in exposing your model to others is to create a Web application with a Geoprocessing task. You'll use ArcGIS Server Manager to create the Web application. Manager will help you choose the map service to display and the geoprocessing service that you want to expose to your users through the Geoprocessing task. Follow these steps to create the Web application in Manager:
Type a name for your application. This name will appear in the URL that users type in their browser when they access your application. Optionally, you can also type a description on this page that administrators can read when they view the list of Web applications in Manager. When you're finished with this page, click Next.
On the second page, you choose which services will appear in your map. Click Add Layer, browse to the map service that you just published in the previous section, then click Add. You may need to first create a connection to your GIS server. If you need help with this page, see Selecting layers to display. When you're finished adding services, click Next to move to the next page.
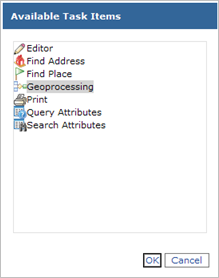
On this page of the wizard, you will add the Geoprocessing task. Click Add Task, choose Geoprocessing, then click OK to add the task.
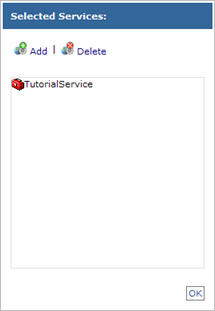
Before configuring the task, you need to designate a geoprocessing service for the task to use. Click Supporting Services, click Add, then, in the same way that you browsed for your map layer on the previous page, browse to your geoprocessing service.
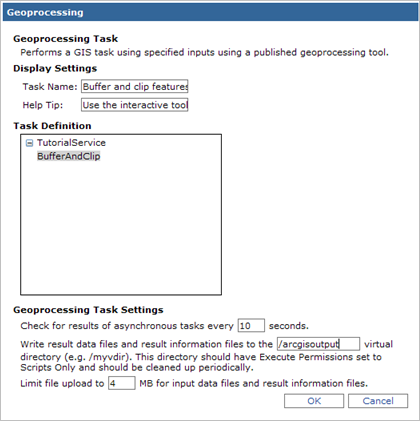
Click Geoprocessing in the list of Current Tasks and click the Configure button. On this dialog box, you can change the task name from Geoprocessing to something more descriptive. You can also add a help tip that will appear when users hover the mouse pointer over the task.
If you have multiple models in your toolbox, this is where you can choose the one that will appear in your task. You can only use one model per task.
In this example, you can keep the defaults for the Geoprocessing Task Settings. The topic Geoprocessing task explains more about results files and synchronous vs. asynchronous tasks and will help you understand these settings.
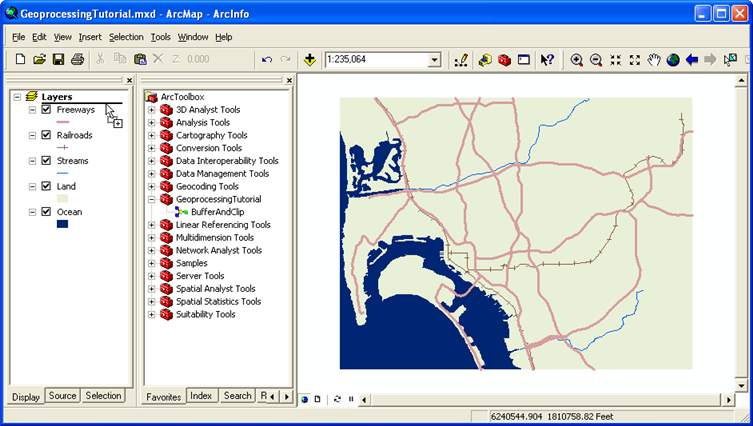
Test your Web application by opening the Geoprocessing task. Define some points and run the tool to see the clipped buffers.