The following example uses a dataset containing building polygons to describe the ArcGIS archiving functionality.
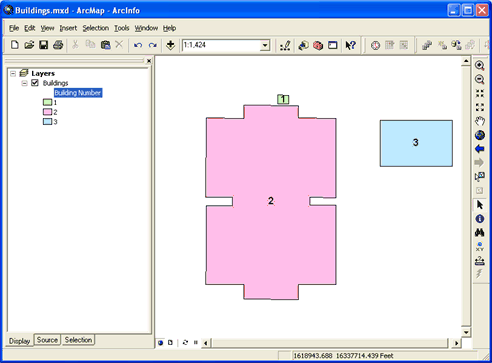
The building dataset consists of three buildings:
These buildings have had several edits applied to them. After each edit was made, it was saved to default. The Archive class therefore has kept a record of each edit made to the buildings feature class. After each edit was made, a historical marker was created in the Historical Marker Manager. This makes it easy to connect to the historical version for the moment of each particular edit.
Learn more about working with historical markers.
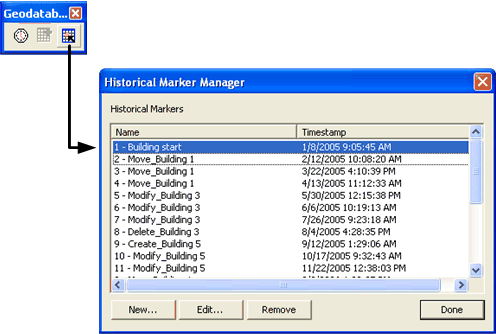
The following graphic shows the Historical Marker Manager being opened from the Geodatabase History toolbar. The manager displays the historical markers that were made:
By changing to a historical version of the buildings feature class, the Geodatabase History Viewer becomes enabled.
Learn more about working with a historical version.
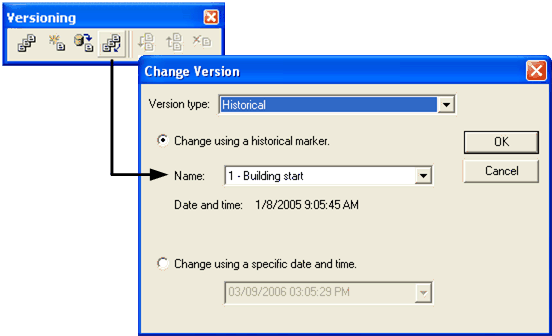
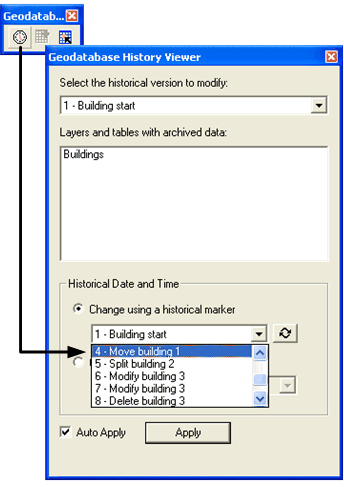
The following graphic shows the Change Version button on the Versioning toolbar being pressed to open the Change Version dialog box. The 1 - Building start historical marker is used to change to a historical version:
Now that the Geodatabase History Viewer is enabled, it is easy to switch between the historical markers designated for each edit and view the representation of the buildings throughout their history.
Learn more about working with the Geodatabase History Viewer.
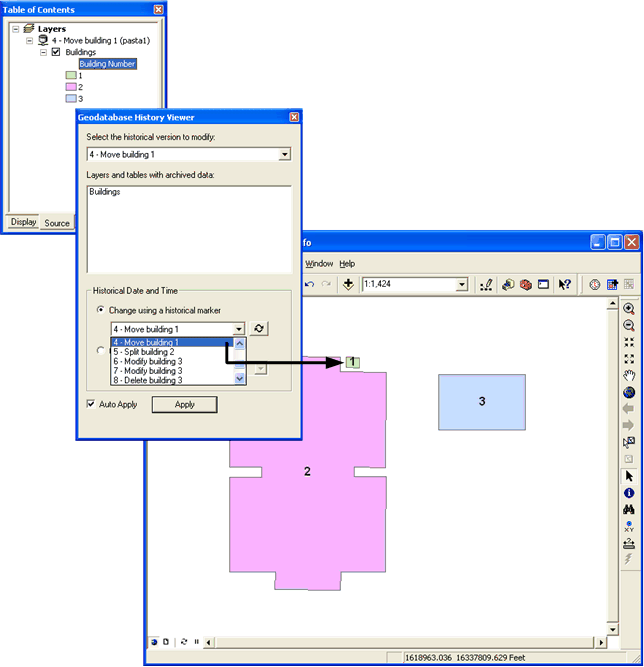
The following graphic depicts the Geodatabase History Viewer button on the Geodatabase History toolbar being clicked to open the Geodatabase History Viewer. The 4 - Move building 1 historical marker is used to change the map view to reflect the historical version particular to that historical date and time:
Switching to the 4 - Move Building 1 historical marker shows the moment in time when the edit was made to move the location of building 1:
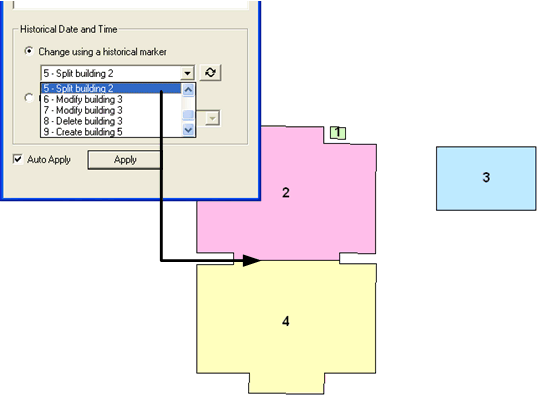
Historical marker 5 - Split building 2 shows the moment when building 2 was split into buildings 2 and 4:
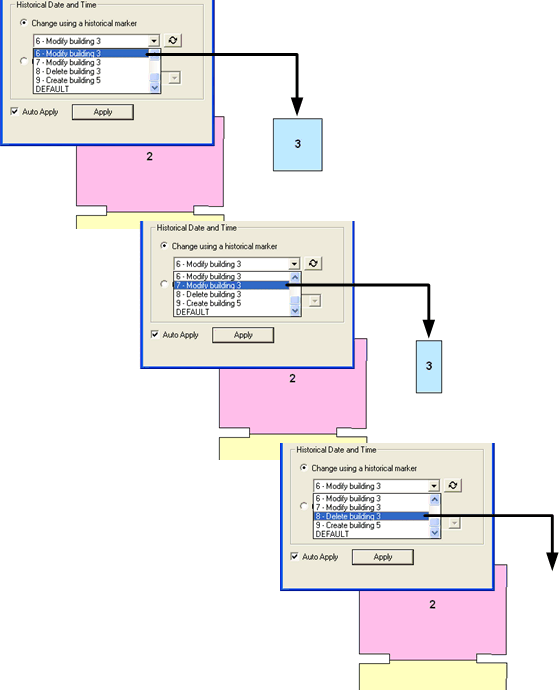
By switching through historical markers 6, 7, and 8, you can see how building 3 is modified and then deleted over time:
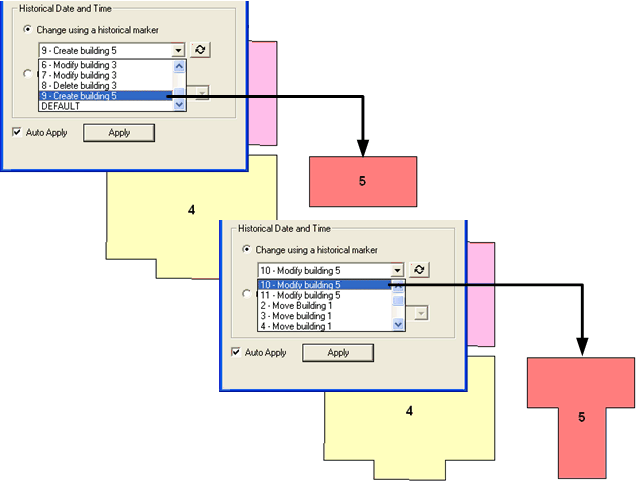
The historical markers 9, 10, and 11 display the moments in time showing edits to create building 5 and then add an extension to it:
You can also add the buildings archive class to the map in order to view all the representations of the buildings throughout their history.
Learn more about working directly with the archive class.
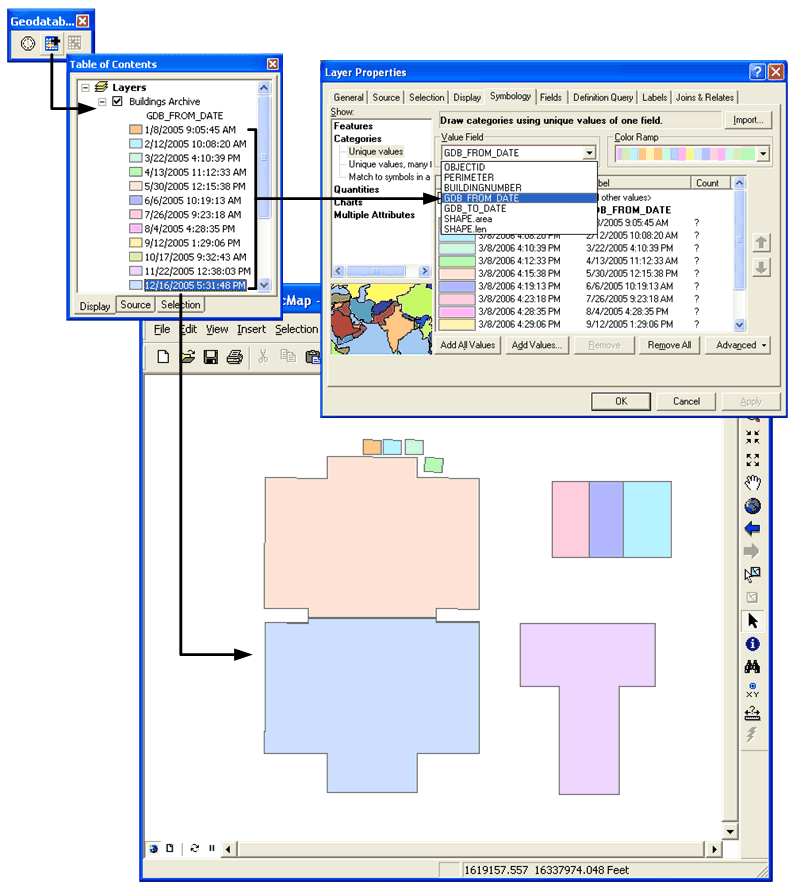
The following graphic shows how symbolizing the map with the values from the GDB_FROM_DATE field can color code the archive class based on the moment in time when updates were saved to default. This displays the various representations of each of the buildings throughout the history of the dataset. Building 4, being the last building updated, is color coded for the most recent date and time: