Drawing features using graduated and unique symbols expand/collapse all
Related Topics

Drawing features using one symbol

Using images as symbols

Setting the scale dependency of symbols and renderers

Adding renderers and symbols

expand/collapse item About using graduated and unique symbols

You can draw features on a layer based on attribute values. When you draw features using graduated symbols, an equal interval classification scheme is applied. A single field's range of attribute values is divided into equal-sized subranges. The field must contain quantitative data, which describes features in terms of their magnitude. Each subrange of values is assigned a symbol. The symbols graduate from a start size and color to an end size and color. Many types of data lend themselves to this type of classification, for example, population density, sales, precipitation, and suitability data.

When you draw features using unique symbols, each unique attribute value or feature characteristic is symbolized by a different color. For example, all polygon features classified as residential would have the same symbology, while polygons classified as retail would have different symbology. Drawing features using unique symbols makes it easy to quickly see which feature classifications are dominant, how feature types are distributed, and whether there are any obvious patterns.

expand/collapse item How to create graduated and unique symbols

expand/collapse item Drawing features using graduated symbols

  1. Click a layer in the legend to make it active.
  2. Click the Layer Properties button Layer Properties on the Author toolbar to open the Layer Properties dialog box.
  3. Click the Symbols tab.
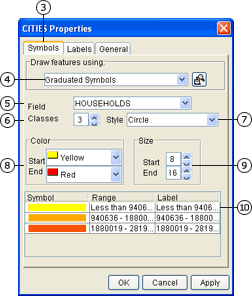
  4. Click the Draw features using the dropdown arrow, and click Graduated Symbols.
  5. Click the Field dropdown arrow, and click a field.
  6. Click the up and down arrows on the Classes box to change the number of classes.
  7. For point layers, click the Style dropdown arrow, and click a style.
  8. Click the Start and End dropdown arrows, and choose start and end colors.
  9. For point and line layers, click the up and down arrows on the Start and End boxes to change start and end sizes.
  10. Double-click the first label in Label column. Type a new label.
  11. Repeat step 10, typing new labels for each subrange. A subrange includes all values equal to or greater than the lower limit and less than the upper limit of the subrange.

    These labels appear in the legend.

  12. Click OK to apply your changes and to close the Layer Properties dialog box.

expand/collapse item Drawing features using unique symbols

  1. Click a layer in the legend to make it active.
  2. Click the Layer Properties button Layer Properties on the Author toolbar to open the Layer Properties dialog box.
  3. Click the Symbols tab.
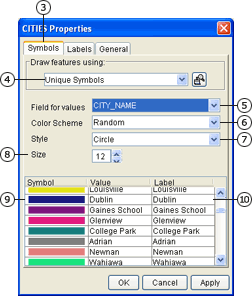
  4. Click the Draw features using the dropdown arrow, and click Unique Symbols.
  5. Click the Field for values dropdown arrow, and click a field.
  6. Click the Color Scheme dropdown arrow, and click a color scheme.
  7. For point layers, click the Style dropdown arrow, and click a style.
  8. For point and line layers, click the up and down arrows to change the Size, or type a value in the Size text box.
  9. Click a symbol in the table to change its color.
  10. Double-click the first label in the Label column. Type a new label.
  11. Repeat steps 9 and 10, assigning a new color and label to each symbol.
  12. Click OK to apply your changes and to close the Layer Properties dialog box.

expand/collapse item Tips

Choosing colors for graduated symbols

When choosing colors for your symbols, click Custom to see more colors than are available in the dropdown list.

Removing outlines around polygon features

To remove outlines from polygon features, check Remove Outline on the Symbols tab of the Layer Properties dialog box.


Search code: @author_grad_symbols